Beyond Key ensures that our technical skill set is always up-to-date with the most current and latest technologies to support and enhance delivery capabilities.
Beyond Key excels in consulting with experience and delivering tailored, contextual solutions to complement your company’s goals on a variety of platforms.
Beyond Key provides access to a full-fledged library of curated content elaborating on our client case studies, technological processes, customer experience resources, and relevant tech news.
Beyond Key is a leading software development and IT consulting company, specializing in custom solutions and leveraging transformative Microsoft technologies. With a sharp focus on AI, we utilize Microsoft technologies, including SharePoint, Teams, Dynamics 365, and Power Platform (Power BI, Power Apps, and Power Automate). Our innovative methodologies and expertise give businesses a decisive competitive edge.
Automate your financial planning & analysis with Microsoft powered Financial Analytics Dashboards
Discover the power of insightful data at your fingertips with our Financial Analytics. Access our finance analytics dashboard and explore limitless insights firsthand.
Let's dive deep into why automating financial planning and analysis matters to financial leaders and decision makers.
The truth is, doing financial analysis and planning manually is a real drag. It's all about legacy systems and those mind-numbing Excel spreadsheets. It eats up your time, and the complexity of it all can make your head spin. Not to mention, it's easy to make mistakes and end up with unreliable financial reports.
But here's the deal: managing crucial financial data demands accuracy that goes above and beyond. And that's where advanced technology comes in.
Our financial analytics dashboards are the real deal. They turn your financial data from different sources into one reliable source of truth. It's like becoming a data wizard, but without the crazy spells. And the best part? It's 100% accurate.
So, forget the headaches of manual financial analysis and planning. With our top-notch financial dashboards examples, including finance tableau dashboard, you'll have the power to make sense of your finances, report like a pro, and keep your metrics in check. It's the ultimate financial data dashboard
Advantages of having an automated financial analytics dashboard
solution are immense & Here we have covered some of
those key benefits
Quick & Accurate FinancialHealth Overview
Financial analytics empowers you to dissect revenues, expenses, and all financial elements across diverse segments with precision. It helps you generate quick reports based on financial models used in corporate finances globally and assists you in making informed financial decisions before it is too late.
Simplify Your Work
Using an avid suite of financial dashboards decision makers & financial professionals in your organization can evaluate the financial viability of your ventures, construct diverse scenarios that factor in every opportunity cost and integrate all tangible and intangible aspects into your financial models, considering every potential risk.
Works with you as a vigilant companion
A financial analytics dashboard not only helps you create insightful visual reports related to aspects of your cash flow but works along with you as a data driven partner in crafting strategies, blueprints, and budgets for the next 3 to 5 years. With a suite of these machine learning powered dashboards, you can design monthly budgets tracking revenue, cash flow, expenses, and debt reductions, and keep a close watch on your financial roadmap.
Prepare for Future Spending
With predictive analytics capabilities these dashboards help you predict future financial trends and based on your upcoming needs you can reiterate your future financial investments. With our custom reports you can measure gaps between targets and outcomes, while our interactive dashboards let you deep-dive into segment performance. We go beyond just reporting; we enable root cause analysis, giving you the power to act, not react.
Financial Dashboard Examples
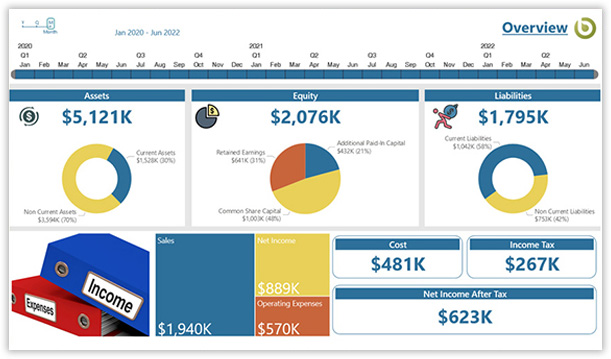
Financial Overview
Stay informed about your business health and profitability with our Financial Overview dashboard. It displays key metrics for your assets, equity, sales net income, liabilities, cost, taxes, and more, delivering an encompassing view of your financial analytics dashboard.
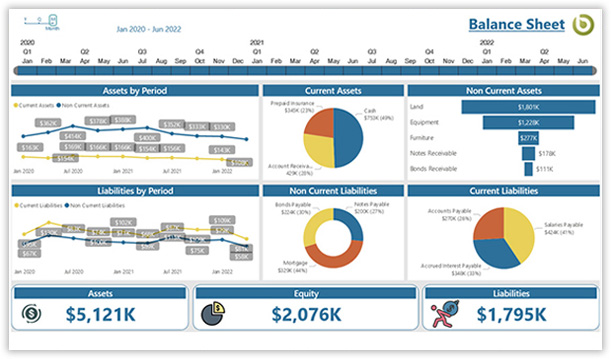
Balance Sheet Dashboard
Our Balance Sheet dashboard provides a snapshot of your company's financial health at specific intervals. It lists all assets, liabilities, and equity of your organization, serving as a practical application of financial dashboards examples.
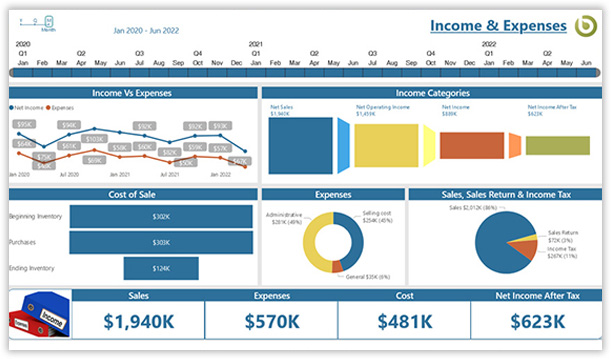
Income and Expense Dashboard
Track your net income and expenses overtime with our income statement dashboard. This dashboard provides granular data on your overall cost of sales, expense, sales, sales return, income taxes, and more, presenting another facet of our financial dashboard examples.
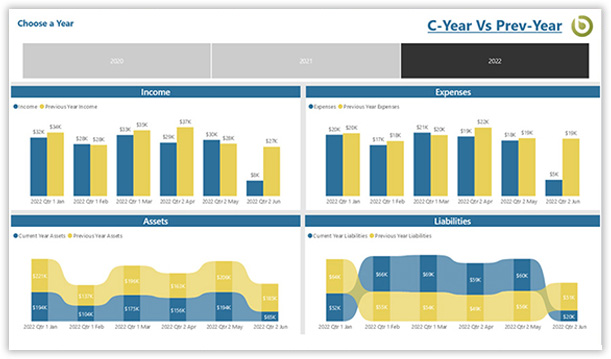
Current Year Vs Previous Year
Gain quick insights, make better decisions, and measure all data accurately in real-time with our financial report dashboard comparing yearly assets, liabilities, income, and expenses. This comparison dashboard is a vital component of our financial reporting dashboards.
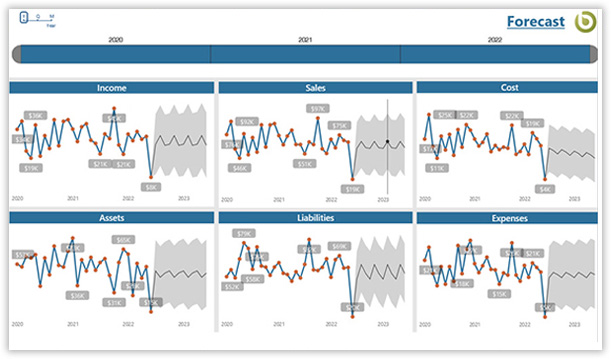
Forecast Dashboard
Predict future trends in your company's annual financial state with our Forecast dashboard. It provides forecasting analysis of income, sales, costs, expenses, assets, and liabilities, adding another dimension to our financial dashboard's examples.
Book your personalized demo today
to see how our financial report dashboard can elevate your financial reporting
Beyond Key's Power BI Financial Solution has revolutionized our financial analytics. Their customized solutions and expert guidance have empowered us to make data-driven decisions with precision. Our financial reports are now accurate, insightful, and delivered with remarkable efficiency. Highly recommended.
Christine
Chief Financial Officer
We cannot speak highly enough of the Power BI Financial Solution. Beyond Key’s expertise in dashboard development and report creation has transformed our financial reporting capabilities. The visually engaging and customized reports have enabled us to present complex financial information with clarity, aiding our stakeholders in making strategic decisions.
Sarah
Finance Director
Beyond Key's has helped fortify our financial analytics infrastructure. The seamless integration of Power BI with our existing systems has provided us with a unified view of our financial data, facilitating accurate and timely analysis. Their advanced analytics capabilities have unveiled valuable insights, enabling us to adapt our strategies and thrive in a highly competitive market.
David
Financial controller
Frequently Asked Questions
What is Financial Planning and Analysis (FP&A)?
FP&A is a strategic, forward-looking function that uses financial insights to drive business performance. It involves budgeting, forecasting, and analyzing financial data to guide leadership in making sound business decisions. Essentially, it's the financial backbone that navigates your business towards its financial goals.