Every company wishes to have a strong financial foundation, which eventually becomes the company’s core strength. Financial teams work hard to keep their data safe and structured so that they can make educated and accurate business choices using analytics. These financial analytics not only aid in the creation of a clear image of their firm now, but also pave the way for future forecasts, budgets, and roadmaps. Let’s look at how financial analytics can help you take your business to the next level in this blog.
Financial analytics refers to the process of collecting, visualizing, monitoring, analyzing, and predicting financial data. This is done to evaluate the performance of a department or company to make better financial decisions. Managing finances is about numbers, and understanding these numbers determines an organization’s success. Financial facts and figures are challenging to interpret precisely and meaningfully.
The dozens of features of finance analytics tools enable you to get precise and unobserved information, which removes all complexities. Cash flows, revenue, and expenses can be monitored across the organization.
Using financial and other relevant information, financial analytics provides insight into past, present, and future performance. Below is a list of key types of analytics that can be used by companies of all sizes:
Predictive sales analytics: This involves using correlation analysis or past trends to forecast corporate sales.
Client profitability analytics: It helps to identify clients who generate revenue for a business and those who do not.
Product profitability analytics: It involves evaluating each product individually rather than measuring profitability as a whole.
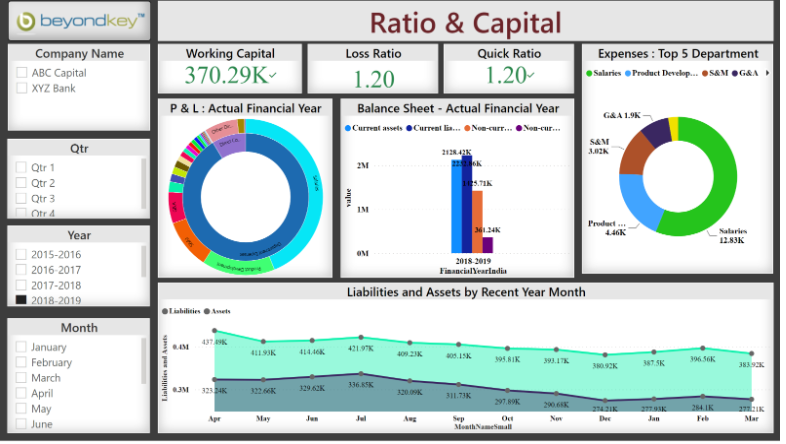
Cash-flow analytics: This method incorporates real-time indicators such as the working capital ratio and the cash conversion cycle, as well as regression analysis to predict cash flow.
Value-driven analytics: Entails identifying the key drivers of business value, or the levers an organization needs to pull to succeed.
Shareholder value analytics: Calculates the value of a business based on its returns to shareholders. It is used in conjunction with profit and revenue analytics.
Financial analytics is a lot like your best friend who can predict your next move, only better! It’s like a super-power that gives your business the ability to see into the future, evaluate performance, and make impactful decisions that drive success. Here are some of its delightful features:
Predictive Analysis: Just like a crystal ball, financial analytics uses historical data to forecast future scenarios. Whether it’s predicting your company’s sales or the next big market trend, it has got you covered.
Deep Knowledge Extraction: Financial analytics can extract meaningful insights from your company’s financial data, revealing hidden trends and patterns that can shape your business strategy. It’s like having a secret decoder ring for your company’s financial data.
Real-time Reporting: It offers real-time insights into financial performance, providing you with the ability to make quick, data-driven decisions. It’s like having a financial news reporter in your corner, ready to deliver the latest scoop.
Now that we’ve covered the features, let’s talk about why financial analytics is critically important.
Did you know that companies using analytics are five times more likely to make faster decisions?
Financial analytics is a game-changer. It provides businesses with the tools to shape their strategies and forecast future scenarios, offering a competitive edge in the market. It helps businesses understand their financial status, improves their profitability, and ultimately boosts their value.
Moreover, financial analytics is crucial in identifying risks, improving business processes, and ensuring that investments are channeled into the right areas. It’s like having a GPS for your financial journey, guiding you towards the path of success.
Did you know that Gartner predicts that by the end of 2024, 75% of enterprises will shift from piloting to operationalizing AI, driving a 5X increase in streaming data and analytics infrastructures?
To keep pace with this trend, you need more than just financial analytics tools. You need a robust, integrated solution that can transform your raw financial data into actionable insights. And that’s where we come in with our Power BI financial dashboards.
Ever wonder how to make your financial data tell a story? How to turn those dry numbers into a compelling narrative that drives decision-making? The answer lies in integration. Picture this:
You’re leveraging Oracle Financial Analytics. You’ve got a treasure trove of data waiting to be unearthed. But how? Here’s where Power BI comes in. It connects directly to your Oracle database, dusts off the raw data, and transforms it into an interactive dashboard. It’s like turning a dense, impenetrable novel into an engaging picture book.
Now, imagine you’re using SAP ERP Financial Analytics. You’ve got goals, plans, costs, and revenues to monitor. But it’s all too much to take in at a glance. Enter Power BI, with its SAP ERP connectors. It takes that overwhelming flood of data, channels it into a manageable stream, and displays it in a way that makes sense to you.
What if you’re team IBM Cognos Finance? There’s no direct connector to Power BI. Does that mean you’re left out in the cold? Absolutely not. Export your data in a Power BI-friendly format, import it into Power BI, and voila! You’ve got your data speaking your language.
Finally, there’s MATLAB. It’s got computational power, but you need more. You want to see your data, interact with it, understand it. Again, Power BI comes to the rescue. Using MATLAB’s Power BI connector, you can turn your data into a visual narrative that’s easy to understand and hard to ignore.
Integrating Power BI with your financial system isn’t just about making your data look pretty. It’s about making it speak to you, telling you its story, and helping you make better, data-driven decisions.
Let’s talk about the types of financial analysis. Each type serves a unique purpose and provides different insights into your business.
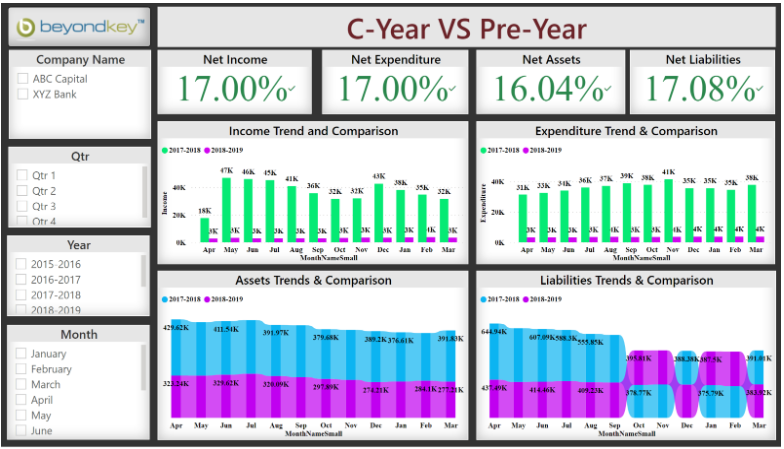
Horizontal Analysis: This involves comparing your organization’s financial performance for consecutive reporting periods to identify major shifts in the data.
Vertical Analysis: Here, each line item on a financial statement is listed as a percentage of another item, providing a proportional analysis of the financial statement.
Short-term Analysis: This involves a detailed review of working capital, calculating turnover rates for accounts receivable, inventory, and accounts payable.
Multi-company Comparison: This involves comparing major financial ratios of different organizations, usually within the same industry, to determine their relative financial strengths and weaknesses.
Investments, credit extensions, cash flow, and other issues are all covered by financial reporting software and business intelligence reporting solutions. For tax purposes, financial reporting and analysis are also essential.
However, different types of financial reporting might be used for different goals. Here are some of the following:
Income Statement: An income statement, also known as a profit-and-loss report, summarizes the company’s incomes and expenses over a certain period on four key factors: revenue, expenses, gains, and losses. In this statement, the main objective is to determine if the business is profitable or not. As a result, it summarizes the key sales activities, production costs, and other costs associated with an accounting period. The report calculates the profit (or loss) made by the business by deducting revenue from all expenses.
Balance Sheet: In this financial statement, a company’s assets, liabilities, and equity are detailed. In a nutshell, a balance sheet provides a snapshot of the financial health of the company at a certain point, which is usually a month or quarterly interval, and it can be used to report financial results internally or externally.
Cash Flow Statement: A cash flow statement shows the amount of cash a company generates and how it is spent. It consists of parts of both the income statement and the balance sheet and is thus essential to successful business management. In a cash flow statement, all the cash received and paid is categorized into three distinct areas. The operating cash flow shows revenue, costs, gains, and losses, while the investing cash flow shows debt and equity purchases and sales. We also have the financial one, which reveals long-term liabilities, such as loan payments, and equity items, such as stock sales.
A financial dashboard is a management tool used to track all financial KPIs, control cash flow, streamline expenses, and monitor sales, profits, and earnings to meet and exceed financial goals for a department or company.
Today, financial professionals and departments face greater pressure than ever to provide fast insights, clear and reliable financial reports, and drive their company’s performance higher. Businesses can quickly comprehend and measure all their data by using financial dashboards. Finance experts can validate figures faster and drill into financial details as much as needed, thereby increasing productivity and ensuring a stable financial climate. You can generate instant actionable insights from all your financial data by using modern financial business intelligence.
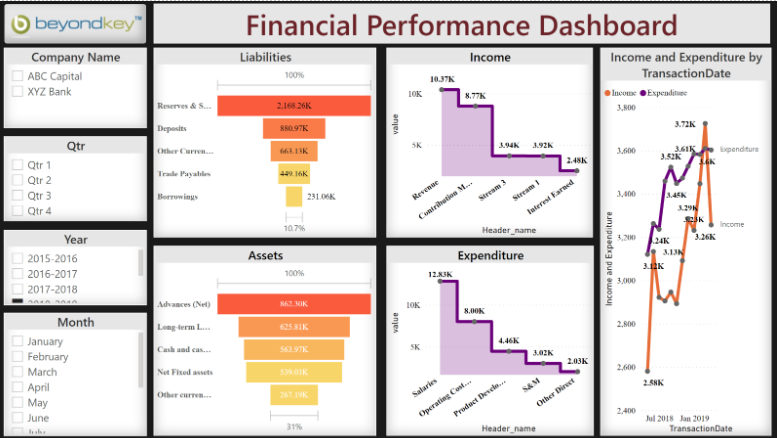
Beyond Key has helped several companies organize and manage their complex financial data. The Finance dashboard templates we have created include various major dashboard samples, including a balance sheet, profit and loss statement (P&L), asset and liability dashboard, revenue versus expenditure dashboard, trend analysis dashboard, and year-over-year comparison.
Let Us Take A Closer Look at Some of These Dashboards
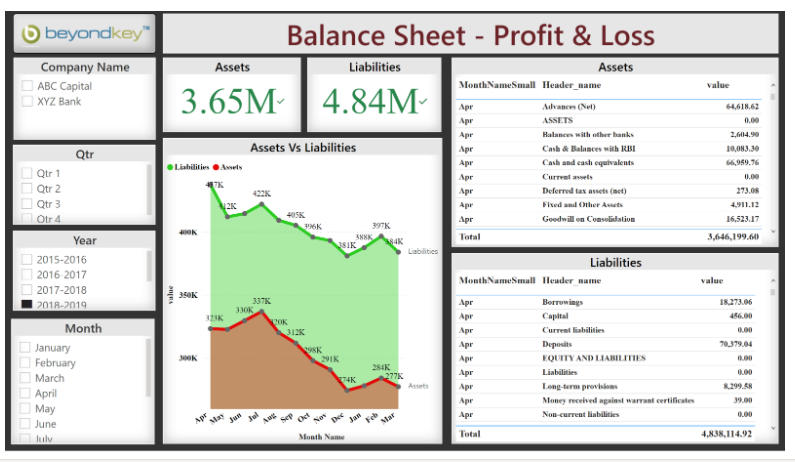
Improved debt management: Debt, as you may be aware, may stifle the growth of any firm, regardless of industry. While there are many various types of financial reporting depending on the purpose or software used, practically all solutions will enable you to track your current assets split by your current liabilities on your balance sheet to assist you to measure your liquidity and managing your obligations.
Trend identification: Regardless of what financial activity you’re wanting to follow, this type of reporting will assist you in identifying past and present trends, allowing you to address any potential weaknesses while making adjustments that will benefit your company’s overall health.
Real-time tracking: You will be able to make precise, informed decisions quickly by obtaining access to centralized, real-time analytics, avoiding any potential barriers while always ensuring financial fluidity.
Liabilities: Managing your liabilities is an important component of maintaining your company’s financial health. Business loans, credit lines, credit cards, and vendor credit are all important liabilities to keep track of. If you are intending to apply for a business expansion loan, you can examine financial statement data and see if you need to minimize existing liabilities before submitting an official application by using a financial report template.
Progress and compliance: The information provided by the financial reporting software is accurate and robust, so accessing this level of analytical reporting not only improves financial efficiency over time but also maintains 100% compliance. This is a business that continues its activities.
Cash flow: A company’s cash flow, large or small, is important to its ongoing financial position. By using detailed indicators and KPIs in combination, cash flows can be categorized in terms of expected profits and expected liabilities while keeping fund movements safe and fluid.
Communication & data access: With key financial insights and full access to data, you can respond quickly to challenges while improving overall internal communication. As everyone understands new trends and shares important financial data, businesses become more efficient and innovative, protected from potential compliance issues and errors.
A company’s financial analytics is an important process for both small and large business shareholders to evaluate and handle a company’s performance.
By doing so, the company will be able to adjust to its current market trends and operations. From the perspective of bankers, investors, and analysts, financial analytics would generate more reliable, consistent, and timely financial statements.
If you would like to learn more about how Beyond Key can help your business, please schedule a free consultation with our experts today.
Financial analytics is a concept that provides various views of financial data. This helps in giving in-depth knowledge and taking strategic actions to improve the performance of your business. This is the process of gathering, anticipating, controlling, deciphering, and anticipating financial data and determining the results of financial activities within a specific department or the company itself. It assists in making more informed decisions.
Revenues: Your company’s revenues are probably the biggest source of funds. The volume, quality, and timing of revenue can determine your company’s success.
Revenue growth: No previous revenue can be included in analyzing revenue growth since it would distort the analysis.
Revenue concentration: It is guaranteed that no single client can make more than 10% of total revenue. For example, if a customer is generating high revenue now but stops buying, the company might encounter financial problems.
Revenue per employee: It measures how productive a company is. The higher its value, the better it is.
Horizontal Analysis, Vertical Analysis, Trend Analysis, Liquidity Analysis, Solvency Analysis, Profitability Analysis, Scenario & Sensitivity Analysis, Variance Analysis, Valuation Analysis, FP&A Analysis.