In today’s world, everything has time constraints, and everyone needs insights into data in a fraction of seconds. In this case, Data Visualization and Tools associated with Data Visualization provide information in a visual format, such as a graph, chart, or heat map. These technologies facilitate working with and understanding vast amounts of data. Data visualization makes complex relationships and concepts easier to understand. But sometimes, data visualization has the potential to oversimplify, which can have disastrous effects on decision-makers.
To achieve accurate data information in an exquisite, precise, and simplified form, a Data Visualization Tool was launched in 2003 in America called Tableau in June 2019. Salesforce bought Tableau.
For Data Analysis and Business Intelligence, a top Data Visualization tool is presently called Tableau. Tableau was ranked as a leader in analytics and business intelligence by Gartner’s Magic Quadrant.
It was founded in America in 2003, and in June 2019, Salesforce bought Tableau.
It assists users in producing a variety of graphs, maps, dashboards, and stories to visualize and analyze data to aid in business decision-making.
Tableau encourages everyone to know and understand their data. You can connect to your data available in the form of Excel, CSV, etc., or connect directly to your database.
You can build interactive dashboards in Tableau.
There are various advantages and benefits of Tableau.
These are as follows.
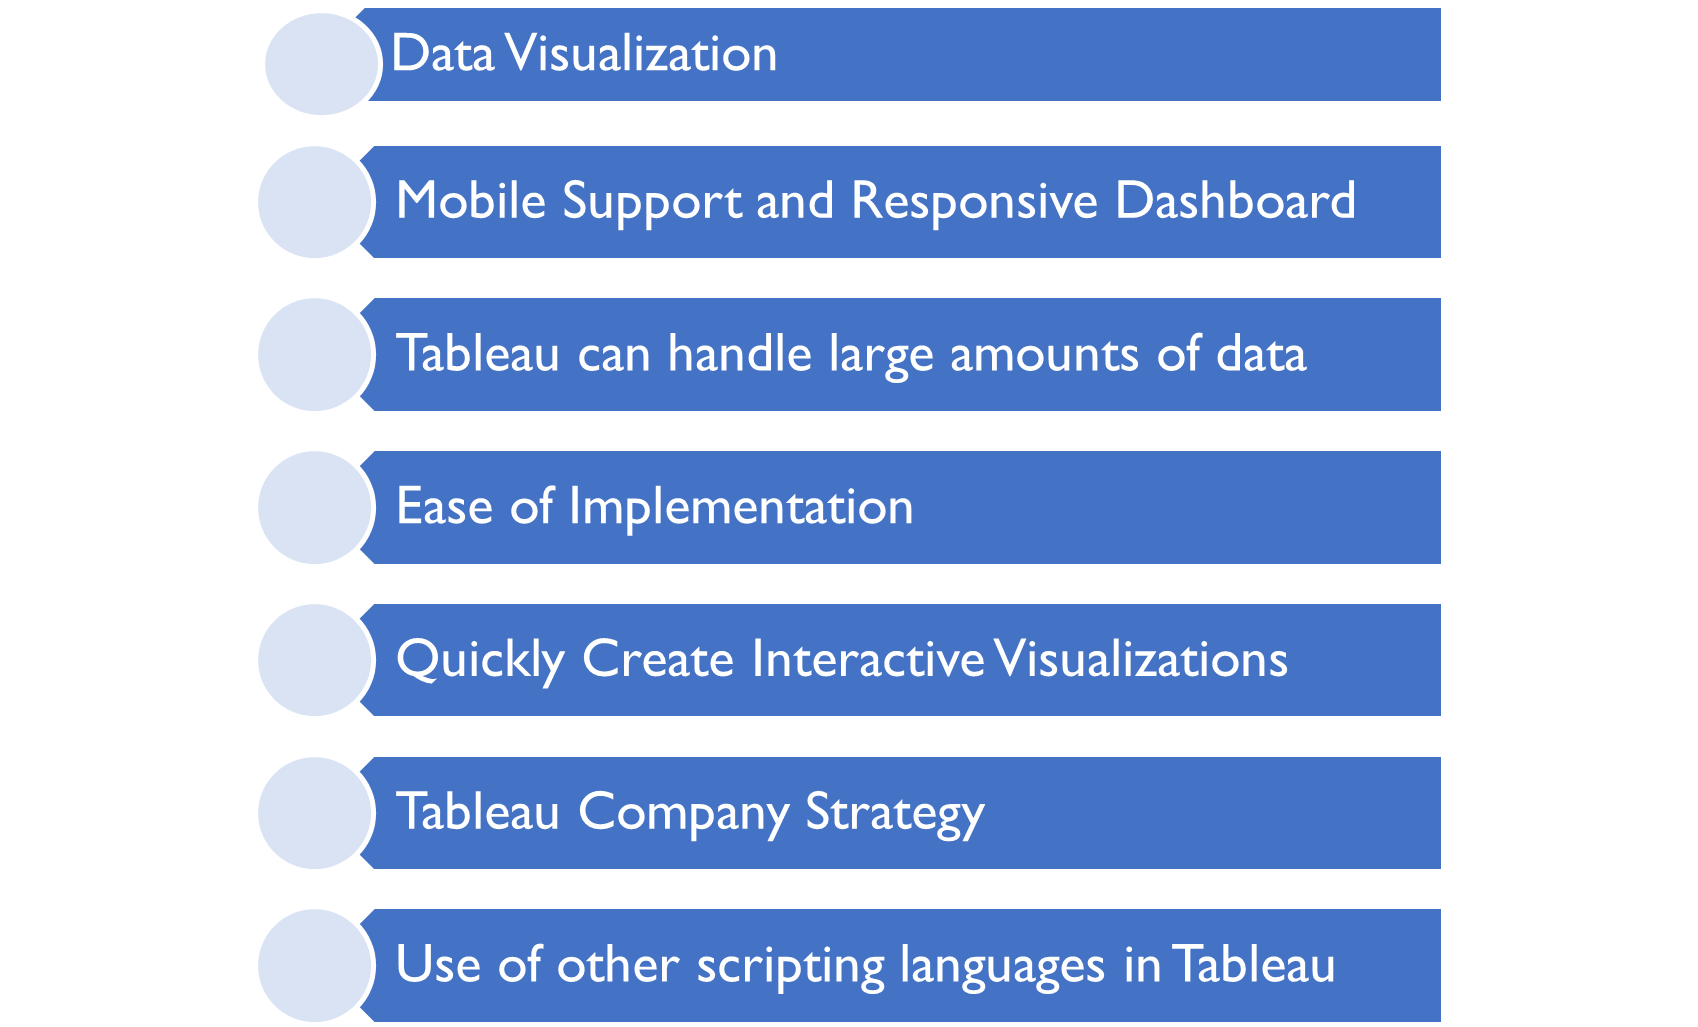
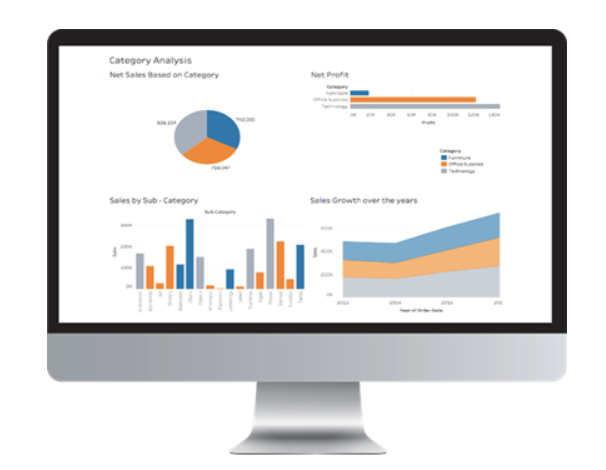
a) Data Visualization:
Tableau is primarily a tool for data visualization. Therefore, its technology supports intricate calculations, data blending, and dashboarding so that stunning visualizations may be produced that provide insights that are difficult to obtain by simply glancing at a spreadsheet. Due to its commitment to achieving this goal, it has risen to the top of the data visualization heap.
b) Mobile Support and Responsive Dashboard:
Tableau Dashboard includes a fantastic reporting function that can tailor the dashboard precisely for a given device, like a laptop or mobile phone. Tableau makes modifications to ensure that the correct report is sent to the appropriate device based on the device the user sees the report on.
c) Tableau can handle large amounts of data:
Millions of rows of data can be handled with efficiency via Tableau. Large amounts of data can be used to generate a variety of visualizations without compromising the dashboards’ performance. Additionally, Tableau has a feature that allows users to create “live” connections to other data sources, such as SQL, etc.
d) Ease of Implementation:
Tableau offers multiple options for visualization that improve the user experience. In addition, Tableau is far simple to learn when compared with Business Objects, Python, and Domo, making it possible for anyone to master it without any prior coding experience.
e) Quickly Create Interactive Visualizations:
The user can quickly construct a highly interactive display with Tableau’s drag-and-drop features. The interface can accommodate many modifications while preventing you from producing charts that go against recommended guidelines for data display. The Tableau Gallery has some incredible images that you may explore.
f) Tableau Company Strategy:
Tableau has done a fantastic job positioning itself as the leader in data visualization software. As a result, per Garner Magic Quadrant, Tableau has been a leader for more than six years. However, Tableau might fall behind if it doesn’t innovate quickly, given the rising popularity of data science, AI, and machine learning. You can tell that Forbes is worried about the profitability of Tableau from the problems with the 2017 financial reporting.
g) Use of other scripting languages in Tableau:
Users can include Python or R to get around performance problems and do complicated table calculations in Tableau. The software’s workload can be reduced by using Python script to execute data purification operations with packages. However, Tableau does not accept Python as a native scripting language. Consequently, you can import some of the packages or visuals.
Various features of Tableau make it unique from its competitors or other BI tools available in the market.
These features are as follows.
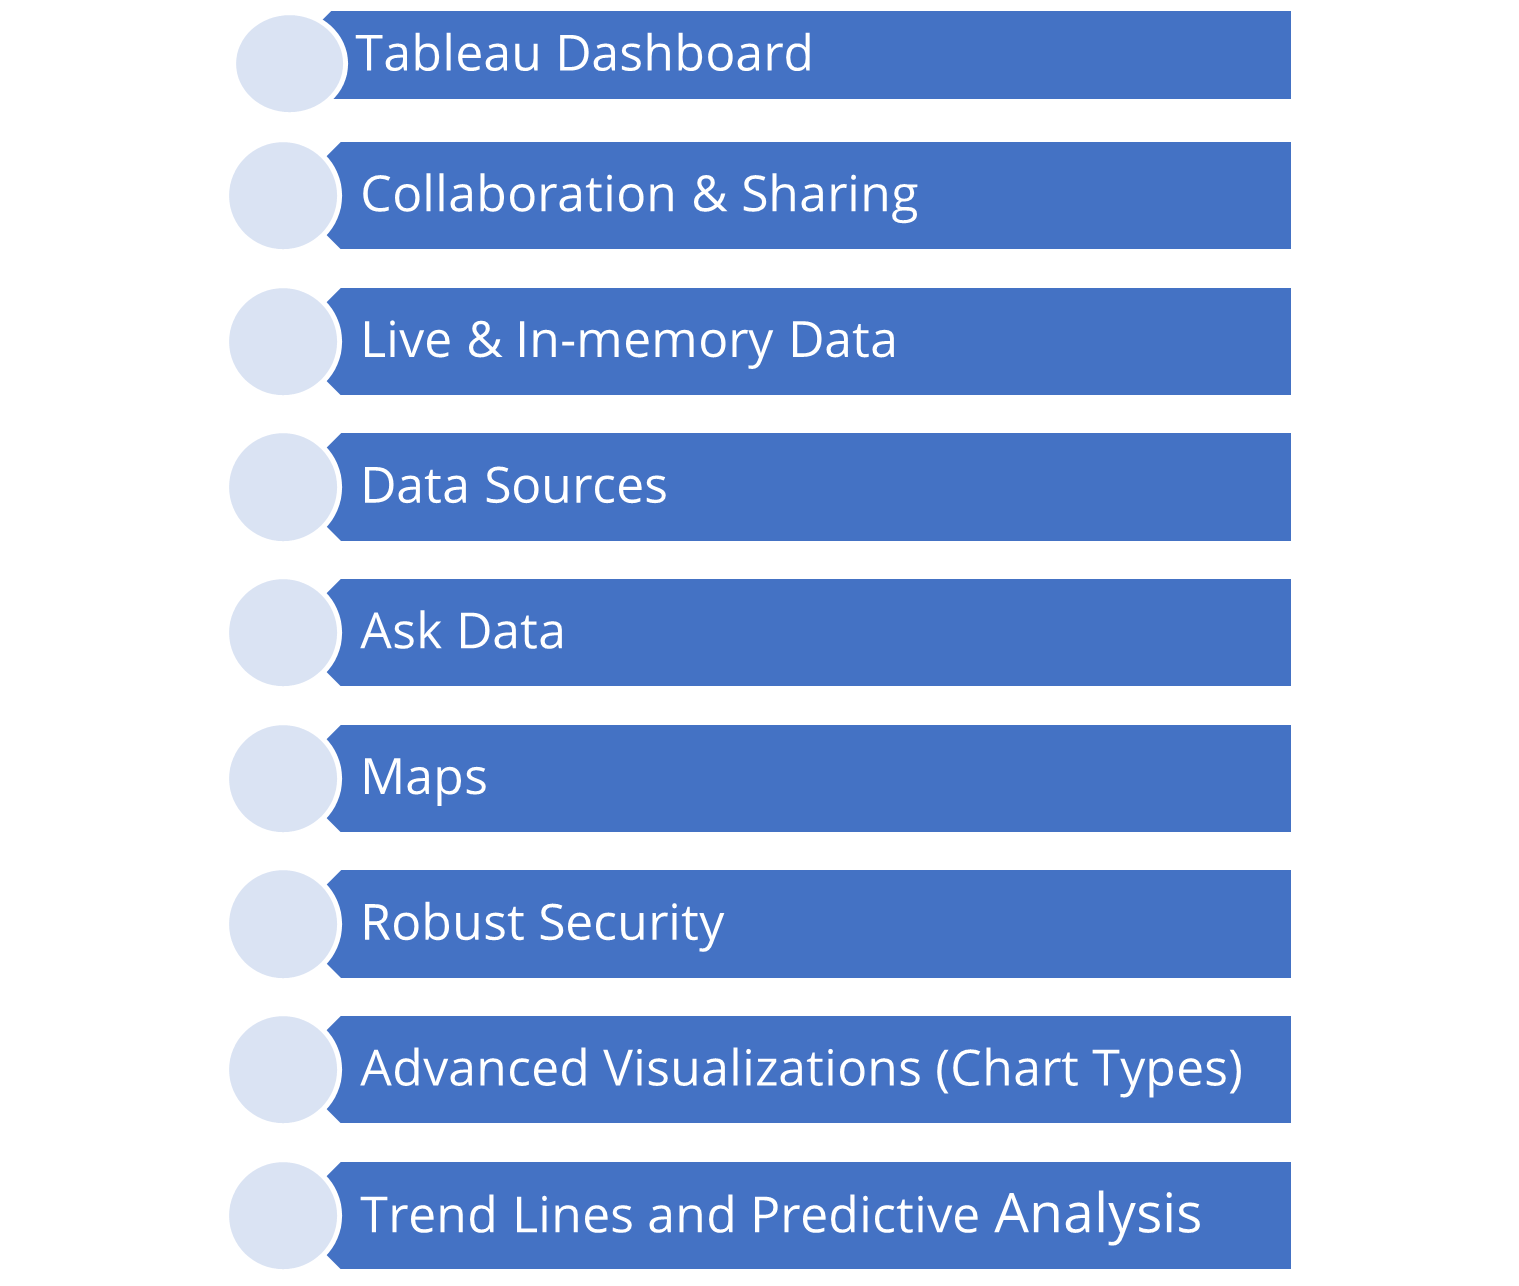
a) Tableau Dashboard:
Tableau Dashboards use text, graphic objects, visualizations, and other elements to give you a complete picture of your data. Dashboards can show data as stories, add various views and objects, offer a range of layouts and formats, and allow users to apply appropriate filters. These features make dashboards particularly informative. Even better, you can quickly duplicate a dashboard or specific pieces from one workbook to another.
b) Collaboration & Sharing:
Tableau offers simple ways for users to work together and rapidly share data through visualizations, sheets, dashboards, etc. You can use it to safely share data from many different data sources, including hybrid, on-premise, and on-cloud. Quick reviews or feedback on the data are obtained through instant, simple cooperation and data sharing, improving the data’s overall analysis.
c) Live & In-memory Data:
Tableau guarantees connectivity to both real-time data sources and external data sources for in-memory data extraction. As a result, the user has complete freedom to use data from various sources without any limitations. By creating live data connections, you can consume data straight from the data source or preserve it in memory by extracting it as needed from a data source. Tableau offers extra tools to help with data connectivity, including automated extract refreshes and alerting the user when a live connection fails, among other things.
d) Data Sources:
On-premises files, spreadsheets, relational databases, non-relational databases, data warehouses, big data, and on-cloud data are forms of data sources. Many forms of data connectors are also supported by Tableau, including Presto, MySQL, Google Analytics, Google Sheets, Cloudera, Hadoop, Amazon Athena, Salesforce, SQL Server, Dropbox, and many others.
e) Ask Data:
Tableau’s Ask data function has increased its popularity among consumers worldwide. This functionality makes altering data as easy as performing standard Google searches. Simply write a natural language question about your data, and Tableau will respond with the most pertinent information. There are both text-based and graphic versions of the answers. For instance, the Ask data option will search and instantly open the bar graph for you if what you sought is already there in it. Users who can quickly go deep into data and uncover novel insights and patterns benefit from the increased accessibility of such services.

f) Maps:
A lot of pre-installed map data, including cities, postal codes, administrative boundaries, etc., is available in Tableau. You can customize the map by adding various geological layers as needed. Tableau offers a variety of maps, including heat maps, flow maps, plethora maps, point distribution maps, and more.
g) Robust Security:
Tableau gives data and user security significant consideration. It has a foolproof security system based on authentication and permission methods for data communications and user access. You have the option to combine Tableau with additional security protocols like Active Directory, Kerberos, etc. It’s crucial to note that Tableau employs row-level filtering, which contributes to the security of the data.
h) Advanced Visualizations (Chart Types):
Tableau’s extensive library of visuals is one of the software’s standout qualities and the reason for its success.
You can create visuals with Tableau that are as simple as a:
Bar chart, Pie chart
More complex is:
Histograms, Gantt charts, bullet charts, motion charts, tree maps, boxplots, and many others.
By selecting the visualization type from the Show Me tab, any sort of visualization is simple to choose and build
i) Trend Lines and Predictive Analysis:
Using Time Series and Forecasting is another fantastic Tableau tool. Tableau’s robust backend and dynamic front end make trend lines and forecasting simple to create. You may quickly obtain data projections such as a forecast or a trend line by just choosing a few parameters and performing drag-and-drop operations on the relevant fields.
There are mainly 5 components of Tableau, and these are as follows:
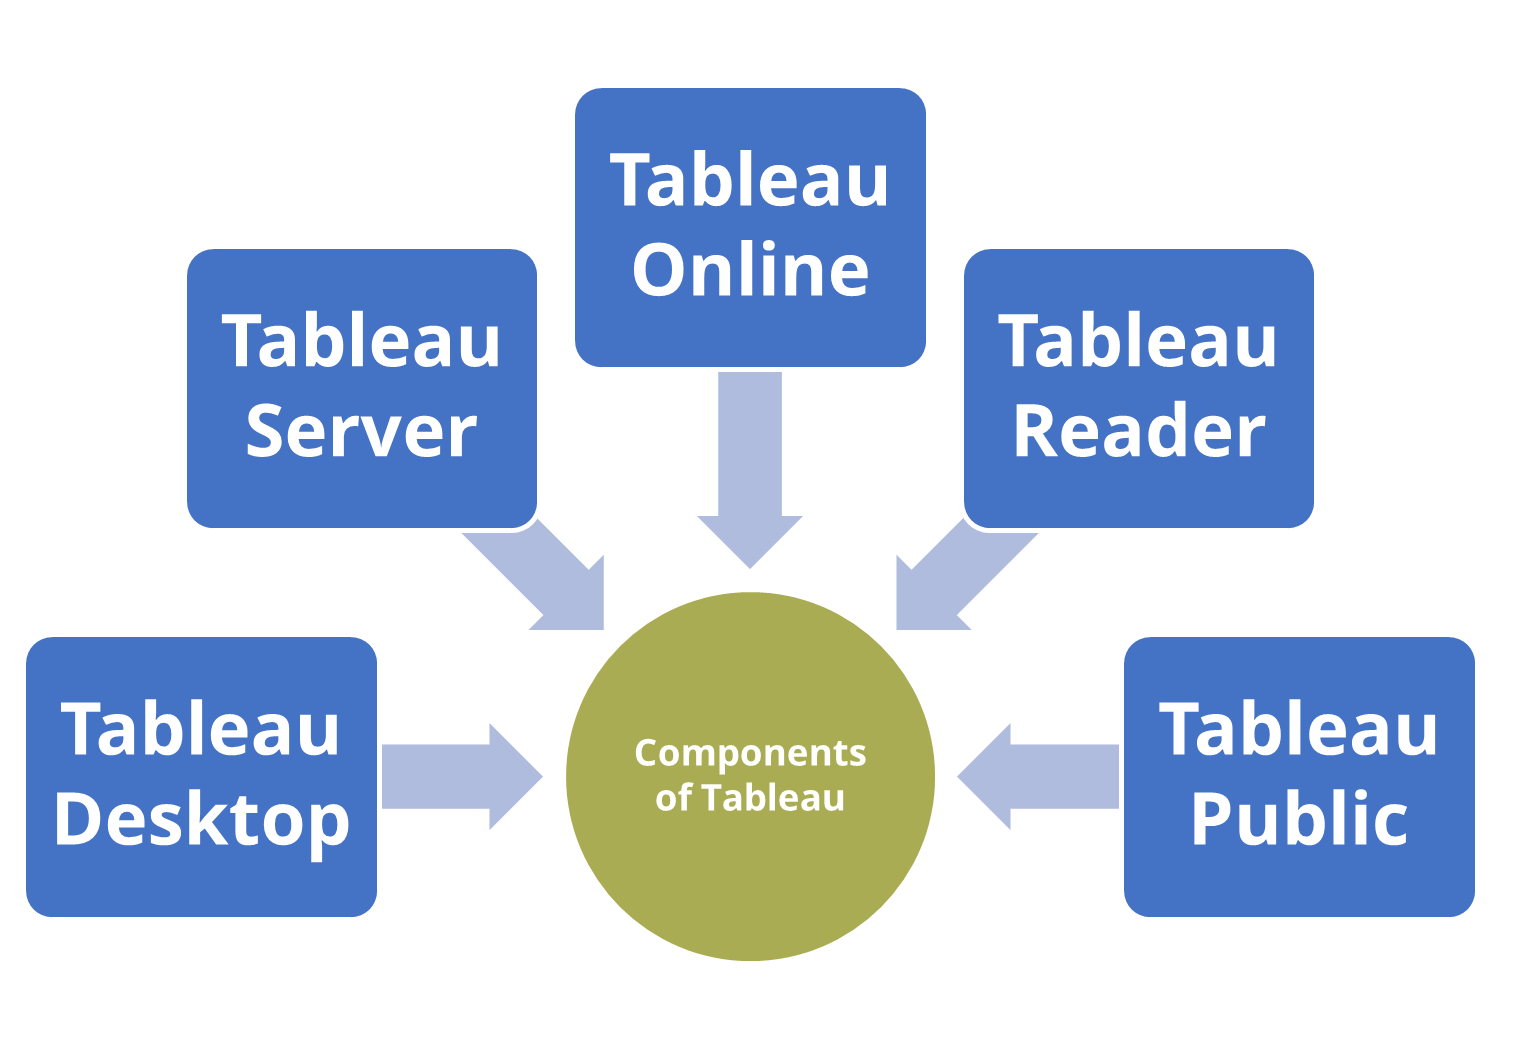 a) Tableau Desktop:
Tableau Desktop is a versatile platform for data analysis and information exploration that any organization can use. One of the most developed platforms for data visualization and analytics is Tableau Desktop, a component of Tableau Software programs. Using the Tableau data source, users may author visualizations, workbooks, and dashboards using Tableau Desktop. Users can share these workbooks or visualizations with them in various ways.
b) Tableau Server:
You can host and manage Tableau data sources, workbooks, reports, and dashboards created using Tableau Desktop on the web platform known as Tableau Server. To build new workspaces, publish reports and dashboards, and share them with other users, you can utilize a web browser to access Tableau Server.
c) Tableau Online:
You can host and manage Tableau data sources, workbooks, reports, and dashboards created using Tableau Desktop on the web platform known as Tableau Server. To build new workspaces, publish reports and dashboards, and share them with other users, you can utilize a web browser to access Tableau Server.
d) Tableau Reader:
You can host and manage Tableau data sources, workbooks, reports, and dashboards created using Tableau Desktop on the web platform known as Tableau Server. To build new workspaces, publish reports and dashboards, and share them with other users, you can utilize a web browser to access Tableau Server.
e) Tableau Public:
Anyone can access online data visualization exploration, creation, and sharing are all free with Tableau Public. Tableau Public makes learning data skills simple by providing access to the world’s largest collection of data representations.
There are 3 License types based on two different conditions.
These are as follows:
1. Deploy with Tableau Cloud Fully Hosted by Tableau
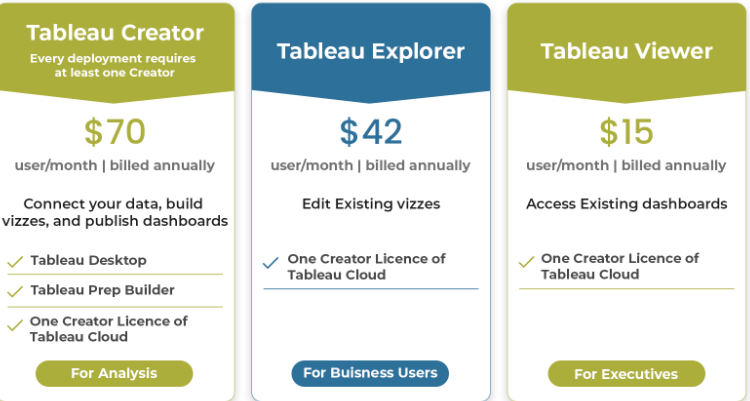
2. Deploy with Tableau Server On-Premises or Public cloud
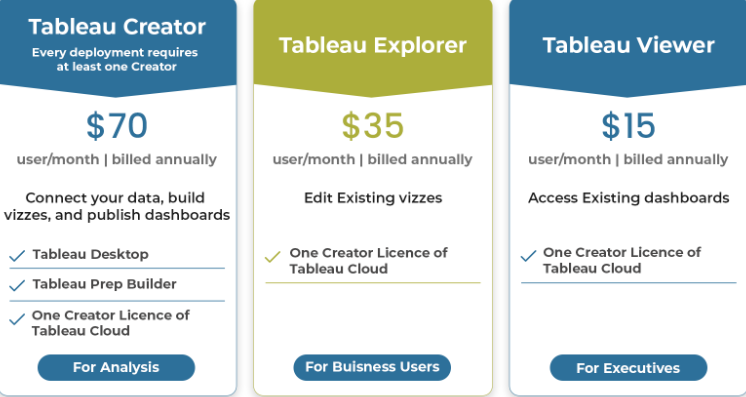
Tableau was ranked as a leader in analytics and business intelligence by Gartner’s Magic Quadrant. For data analysis and business intelligence, a top data visualization tool is Tableau.
Even non-technical people can quickly create dynamic, real-time visuals by building dashboards with Tableau. They can combine data sources, apply filters, and drill down into specific information with only a few clicks.
In this way, Tableau helps various organizations access and record stunning dashboards, charts, etc., based on multiple domains they are working with.
Gain momentum with Tableau today and transform your organization’s data with our top-notch Tableau Consulting Services – start supercharging today!