

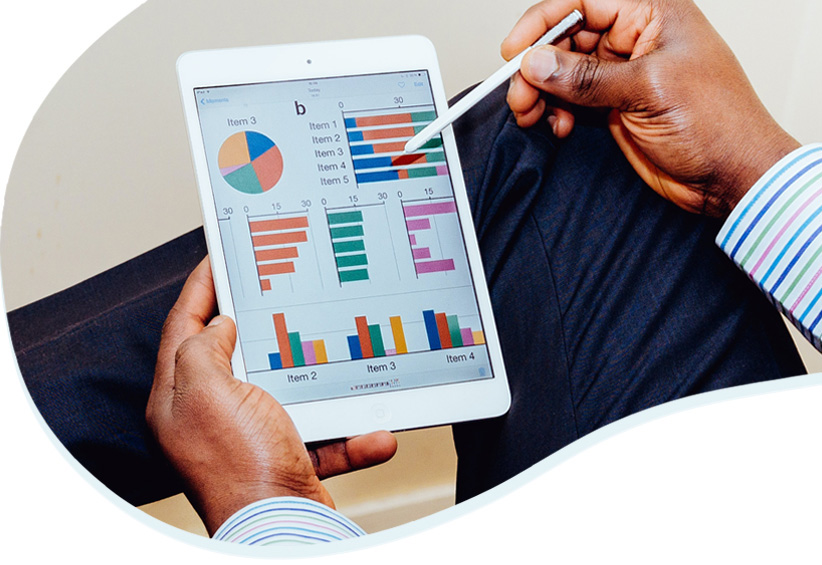


Every modern business generates a constant stream of data. But extracting meaningful insights can be a challenge. Stakeholders often struggle to utilize this data effectively, relying on endless spreadsheets.
Data visualization services can transform your story. Our data visualization consultants leverage modern, automated tools. We convert unstructured data into clear, intuitive charts within minutes. This empowers informed decision-making and unlocks the true potential of your data. Data visualization experts on our team are here to solve your day-to-day data challenges.
What is Data Visualization?
Data visualization is the art of transforming raw data into clear, understandable charts and graphs.
These visuals empower organizations to:

Recognize Trends
Easily identify patterns and relationships within their data.

Identify Weaknesses
Gain insights into areas requiring improvement.

Plan for the Future
Make data-driven decisions to support strategic planning.
Raw data in spreadsheets can be overwhelming. Data visualization services help you organize and compare data (YoY, MoM) through charts and graphs.
This visual representation leverages human's natural visual processing abilities. Makes complex information easier to understand and interpret.
Data Visualization Services
Data is abundant today. But extracting meaningful insights can be a challenge. Data visualization consultants can help transform your raw data into compelling visuals.
Visuals that tell a clear story. Our data visualization services are designed to meet your specific needs and KPIs.
We offer a comprehensive suite of services, including:

Data Visualization Roadmap & Strategy:
Our data visualization experts will collaborate with you to define a roadmap that aligns with your business goals.
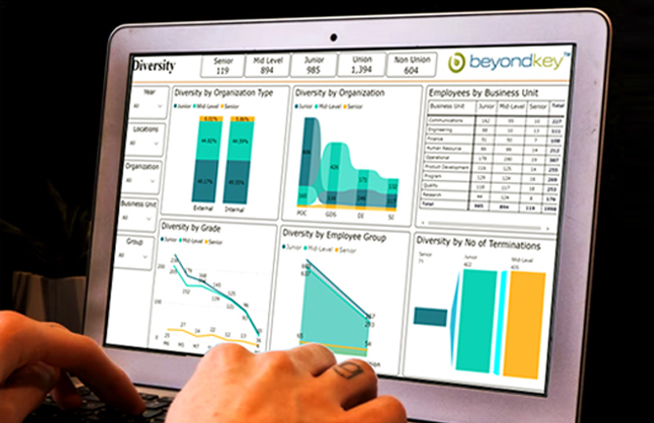
Custom Dashboards & Reports Development:
Our team designs clear, interactive dashboards and reports that transform your data into actionable insights.
Dashboard & Report Theme Design:
We create visually appealing and user-friendly interfaces that resonate with your audience.
Data Optimization & Source Integration:
Data visualization consultants ensure your data is clean, accurate, and integrates seamlessly from various sources.

Data Platform Development:
For complex needs, we can help develop a scalable data platform to support your data visualization initiatives.
Leverage our data visualization consulting services. Gain a deeper understanding of your data.
Wondering how to leverage data visualization for smarter business decisions?
Talk to our BI expertsData Visualization Uses
Data visualization can be a powerful tool for various departments:

Business Operations: Analyze team productivity, department performance, and overall organizational health with clear visuals.

Corporate Finance: Track income, expenses, ROI, profitability, budgets, and forecasts using data visualization dashboards created by our data visualization company.

Healthcare: Identify trends, clinical insights, and operational challenges through data visualization tools.

Manufacturing: Monitor equipment production, potential defects, and identify areas for improvement using data visualization.

Supply Chain: Data visualization consulting services can help evaluate procurement trends, identify risks, and uncover opportunities for optimization.

Marketing: Segment target audiences based on data insights and personalize marketing efforts with compelling data visualizations created by our data visualization experts.

Sales: Generate reports providing a 360-degree view of sales performance and prospects, empowering data-driven decisions.

HR: Track employee activities, onboarding success, talent management efforts, and employee engagement through data visualization dashboards.

Insurance: Combat fraud, mitigate risk, and manage policy and claims lifecycles effectively with data visualizations.

Choosing the Right
Data Visualization Tool
Selecting the right data visualization tool depends on your needs. Here's a look at two popular options:

- A scalable, drag-and-drop data visualization service offered by Microsoft. Power BI integrates with over 3,500 data sources and utilizes ETL (extract, transform, and load) capabilities for intuitive dashboards.
- Data visualization consultants can help you determine if Power BI's self-service model aligns with your needs.

- An enterprise-level data visualization platform known for its power and flexibility. While Tableau requires more setup than some competitors, it offers advanced tools for complex visualizations and handles massive datasets.
- Data visualization companies like us can help you leverage Tableau's capabilities for large-scale data analysis.
Why Choose Us?
With over 20 years of experience in business intelligence and data visualization consulting services, Beyond Key is your trusted partner. As a Microsoft Solutions Partner, our data visualization consultants are experts at delivering end-to-end data management consulting services that empower organizations to make data-driven decisions.
- Uncovering Hidden Insights: We leverage our expertise to extract valuable insights from your data.
- Enhancing Data Exploration: Our holistic service offerings, including Power BI, Tableau, Snowflake, MS Fabric, Databricks, and more, enable you to explore and understand your data more effectively.
- Delivering Comprehensive Solutions: Our team of certified experts specializes in providing tailored data visualization consulting services, ensuring that our clients receive a comprehensive solution that meets their unique needs.
We have a proven track record of implementing and developing data management solutions across various industries, from data strategy and architecture to implementation and support. This domain knowledge, combined with our cross-functional expertise, ensures we deliver superior data visualization solutions that drive business outcomes.
Data Visualization for various functional roles:


Data visualization services across industries:


Hire Data Visualization Consultants
Discover how to turn your data into visualizations that give you actionable data to help your decision-making.
Know MoreResources

Healthcare Analytics and its impact on Hospital Performance
“The Global healthcare analytics market is projected to reach USD $50.5 billion by 2024..
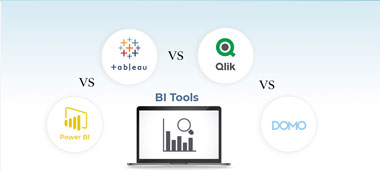
Compare the Top BI Tools: Power BI vs Tableau vs Qlik vs Domo
How smart are your organizations’ decisions? Do you have the right information..
Why your Nonprofit need Data Analytics and BI dashboards?
Data has the potential to become a powerful addition to the work you do, providing..
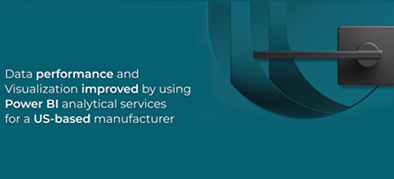
Taymor
North America based manufacturer Taymor leverages Power BI to improve Data Visualization and Performance
HR Analytics
Leading Canadian technology company leverages HR analytics to make data-driven business decisions
GROW
Australian NFP, Grow gets strong data architecture and intuitive BI visuals to improve employee productivity.
BI for NPO (DOMO)
Leading NPO leverages Business Intelligence tools to turn data into live visualization.

Predictive Analytics for Policy Cancellation
We helped a leading insurance company to leverage power of Predictive Analytics to help them reduce policy cancellation rates.

BI Enablement for NPO
We helped a leading healthcare and family center NPO with custom BI dashboards and reports to help them with data visualization and timely reports by integrating with their existing EHR system.
Data Visualization for Healthcare
We helped a leading Non-Profit Healthcare center with custom BI dashboards and reports to help them with data visualization and timely reports.
Power BI: Powerful ways to make your data speak
Every company needs feedback. From the fledgling entrepreneur to the large Fortune 500 companies..


Frequently Asked Questions
-
What is data visualization and why is it important?
Data visualization is the practice of transforming raw data into graphical representation using charts and dashboards. This helps users understand complex data in an easy format.
-
How can data visualization help my business?
It helps your business find out what’s trending while tracking performance. It fosters better and quicker business decision-making.
-
What types of data visualizations do you create?
Our BI experts create dashboards, reports, charts, KPI visualizations, and interactive business intelligence dashboards, depending on your industry and business requirements.
-
What tools do you use for data visualization?
Tools we use for data visualization include Tableau, Power BI, and Looker.
-
How long does it take to build a dashboard or report?
Designing a dashboard or report typically takes 1 to 4 weeks. It depends on how complex your business data is.


