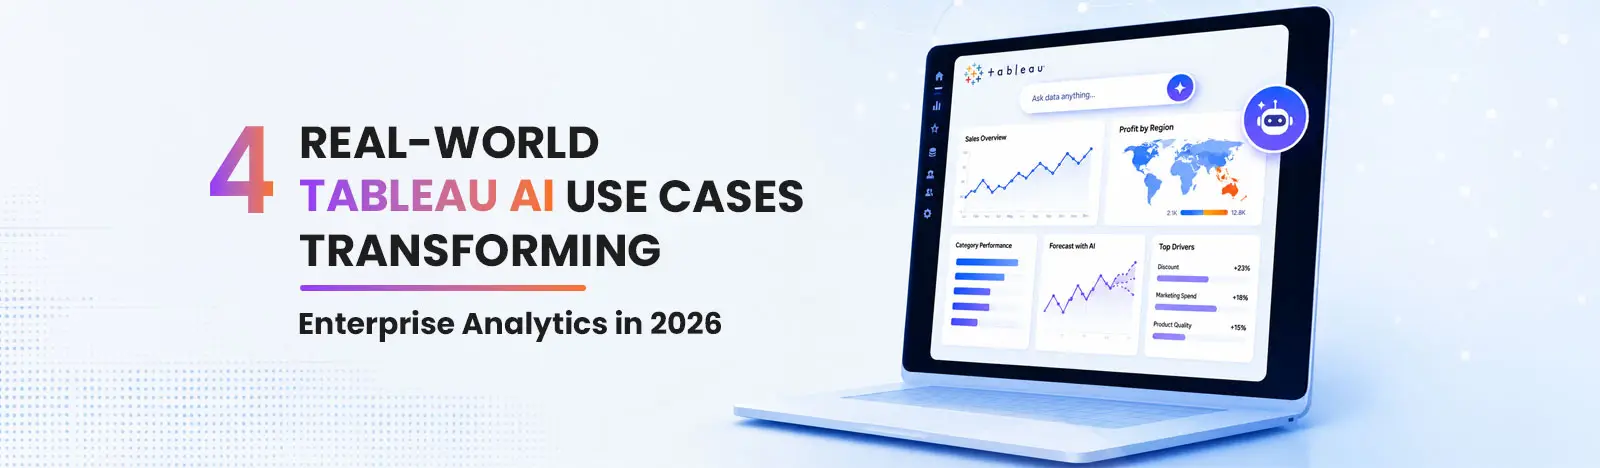
Tableau AI use cases encompass operational anomaly detection, monitoring of KPIs, predictive and conversational analytics, and more. Looking ahead to 2026, Tableau’s capabilities include heat maps, donut charts, scatter plots, and a lot more for deep analysis. Trends, period-over-period comparisons, and composite charts can be analyzed with rich, new visuals. Tableau Agent (conversational, plain-English queries), Einstein Discovery (predictive churn scoring), and Tableau Pulse (proactive metric alerts) are trending in 2026. These help businesses shift from manually working on dashboards to AI-powered tools and services for analyzing data. The four enterprise use cases covered in this guide are executive metric monitoring, sales and conversational BI, predictive churn and forecasting, and operational anomaly detection.
Tableau is not just a mere business analytics platform. It has transformed from a traditional dashboard creation platform into an agentic analytics platform. Known as Tableau Next as an agentic analytics platform, it features extensions such as MCP integrations and automated semantic models, Tableau integrates conversational data exploration and AI elements into everyday workflows.
2026 has changed the way Tableau helps data professionals. Tableau Pulse watches your metrics around the clock. Tableau Agent answers questions typed in plain English. Einstein Discovery builds prediction models without anyone touching a line of code. Below are four real-world scenarios where Tableau helps employees from different industries.
Awards and Recognition (Tableau)
Source: Tableau
Tableau AI is a set of artificial intelligence features that use gen AI and NLP to automate processes across the Tableau platform. It directly integrates into the platform to generate calculations and power conversational analytics.
| Capability | Primary role | Best suited for |
| Tableau Agent | Conversational analytics | Exploring data and creating insights |
| Tableau Agent in Pulse | Metric exploration | KPI and metric analysis |
| Tableau Pulse | Proactive insights | Monitoring business metrics |
| Tableau Next | Agentic analytics | Contextual insights and action |
| Tableau MCP | AI interoperability | Bringing trusted Tableau context into AI tools |
The AI Innovation
Tableau Pulse tracks core KPIs. It includes tracking inventory turnover, daily recurring revenue, and operating margin. It uses natural language processing to find gaps when a metric drifts from the known pattern. With Tableau Pulse, you can check metric deviations with ease.
The 2026 Application
Example: A Chief Operational Officer used to wait for monthly closing to flag a revenue issue. Tableau Pulse has allowed him to surface the anomaly as soon as the week starts. That’s the difference between reacting to Q3 and correcting it mid-quarter.
How can a Tableau consultant bridge the gap?
Pulse’s alerts are only as good as their reach. Tableau consultants embed Pulse summary cards directly on the executive portal homepage, next to board updates and company announcements. Leadership sees the metric card in the same place they read the morning memo; no separate login, no second tab.
The AI Innovation
Tableau Agent takes a question typed in plain English; “Which mid-market accounts in the Western region had declining usage this quarter?”. And returns the answer as a chart. No SQL, no calculated field, no waiting on a BI developer’s backlog.
The 2026 Application
Sales managers who used to submit a ticket for a custom report now build one in the time it takes to type the question. Churn-risk breakdowns and win/loss models that took a developer a week now take a manager three minutes.
How can a Tableau consultant bridge the gap?
They place a conversational BI widget directly inside department-specific sales portals and collaborative workspaces. A regional manager opens their team’s workspace and can ask a question on the spot, during the meeting, without switching tools mid-conversation.
The AI Innovation
Einstein Discovery builds machine-learning models directly on historical CRM and transaction data inside Tableau, without a separate data science pipeline.
The 2026 Application
In retail, signals such as a spike in support tickets combined with shipping delays can be transformed into a real-time churn-risk score for each account. As new data comes in, the score is continuously updated, helping businesses identify at-risk customers earlier.
How can a Tableau consultant bridge the gap?
Tableau professionals surface those risk scores as web parts on the account manager’s daily portal dashboard. Instead of pulling a churn report once a month, the manager sees flagged accounts the moment risk crosses a threshold, while there’s still time to act.
The AI Innovation
IoT sensor streams and ERP data feed directly into automated statistical models that flag anomalies as they happen, not after a shift ends.
The 2026 Application
Plants track assembly line throughput, machine downtime, and vendor delivery timelines in real time. A bottleneck that used to surface in next week’s report now shows up before the shift is over.
How can a Tableau consultant bridge the gap?
They can configure this data for facility-floor digital displays and operational portal hubs, so plant managers see the same anomaly signal on the shop floor that a data analyst sees on their laptop.
Every use case above shares the same failure mode if the insight stays locked inside Tableau: someone has to remember to go look for it. Here’s how Beyond Key closes that gap.
Tableau AI helps organizations automate data operations and scale self-service analytics using trusted Gen AI. Tableau AI protects corporate data while increasing speed in daily operations. Let’s see what the business benefits of Tableau AI are:
| Business need | Tableau AI use case |
| Monitor KPIs | Tableau Pulse |
| Ask questions of data | Tableau Agent |
| Identify trends | Tableau Pulse / Tableau Agent |
| Explore metrics | Tableau Agent in Pulse |
| Predict customer risk | Predictive analytic |
| Detect operational anomalies | Analytics + AI |
| Bring insights into workflows | Tableau Next/integrations |
Financial Services
Retail & E-commerce
Manufacturing
Healthcare
Higher Education
Beyond Key has hired a team of experienced Tableau consultants who provide in-depth data analysis to implement Tableau tools. From consulting to integration, implementation, and dashboard development, we provide proactive guidance to our customers. AI-ML integration, ongoing maintenance, and support also fall under our service umbrella.
We architect fully customized solutions tailored to your needs, unifying siloed data for complete visibility. Our consultants optimize performance, fine-tuning speed and efficiency. We simplify deployment and onboarding, enabling intuitive self-service analytics. With decades of collective experience, we implement best practices for data security, governance, and agile development.
| Enterprise Analytics Challenge | Beyond Key Solution |
| Low adoption and login friction; employees forget to open Tableau | Embed live dashboards and Pulse cards directly into the primary intranet portal |
| Multi-BI complexity; different departments run different platforms | Build a unified Enterprise Analytics Hub that consolidates dashboards from multiple platforms into one view |
| Access control and governance | Implement single sign-on and role-based permissions for secure analytics access across the digital workplace |
Our real-life case study:
| Challenge Our Customer Faced | Beyond Key approach |
| Low Tableau adoption | Embedded analytics in existing workflows |
| Dashboard sprawl | Governed analytics architecture |
| Multiple BI platforms | Unified enterprise analytics experience |
| Poor data quality | Data integration and validation |
| Security concerns | SSO, RBAC and governance |
| Slow dashboards | Tableau performance optimization |
| AI trust concerns | Governed data and semantic definitions |
Partner with Beyond Key– together we’ll maximize your Tableau ROI and become a data-driven organization. To see how we have helped our customers Tableau dashboards, you can click here.
Want to drive higher adoption for your Tableau dashboards?
See how Beyond Key embeds live analytics directly into your corporate portal. No separate login, no forgotten dashboard.
Schedule a Discovery Session