The new age is all about Sales analytics. It is a way of identifying, modeling, interpreting, and predicting sales patterns and outcomes to find and interpret trends and identify areas for development. It is used to assess the effectiveness of a sales campaign and estimate how future iterations will perform.
Data is gathered and evaluated from many pipelines and sources, such as CRMs, application transactions, surveys, and internal applications. It is processed to identify linkages and possibilities that the business exploits. To anticipate future sales, relevant data is extracted and then evaluated.
Sales analytics is the process of collecting, modeling, interpreting, and predicting sales trends and outcomes. It’s the lens through which you view your sales data, helping you spot trends, uncover hidden patterns, and predict future sales performance.
By leveraging data from various sources, like CRMs, surveys, and internal applications, sales analytics enables you to uncover insights that can help steer your business strategy.
Did you know that businesses using analytics are five times more likely to make faster decisions? And these aren’t just any decisions – these are data-backed decisions that can propel your business to new heights.
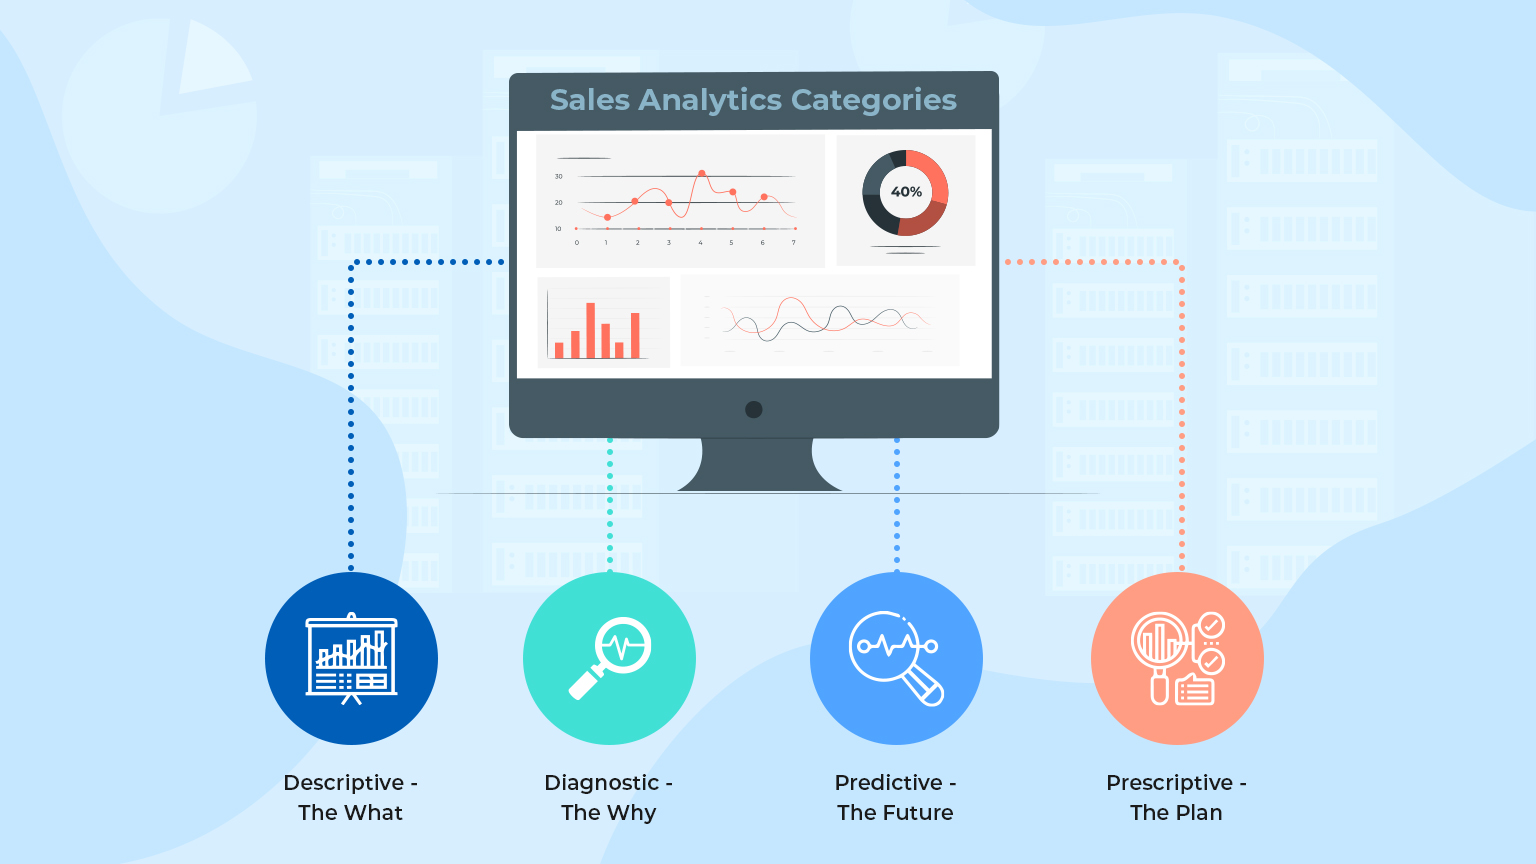
Sales analytics provides critical insights that help you understand where your sales stand today, why they are at that point, and where they are likely to go in the future. This allows you to formulate strategies that are not just reactive, but proactive.
Moreover, sales analytics empowers your sales team to customize their efforts, focus on high-value prospects, and identify new opportunities for the business. It’s like having a magic mirror that shows you the strengths and weaknesses of your team, helping you devise the best training programs, set achievable goals, and foster a cohesive team spirit.
The sales team’s core ability is to use sales analytics. It helps the salesperson find vital trends, dig deep into data, and increase accuracy in forecasting results.
The team can customize their efforts and work with high-value prospects thanks to accurate analysis. It also helps find new options for the organization to explore.
One utilizes sales analytics to identify team performance and assess sectors for improvement. Improved training, more achievable objectives and a cohesive group result benefit from comprehending the strengths and weaknesses.
The right sales analytics tool can be a powerful ally for your sales team. Here are some key features to look for:
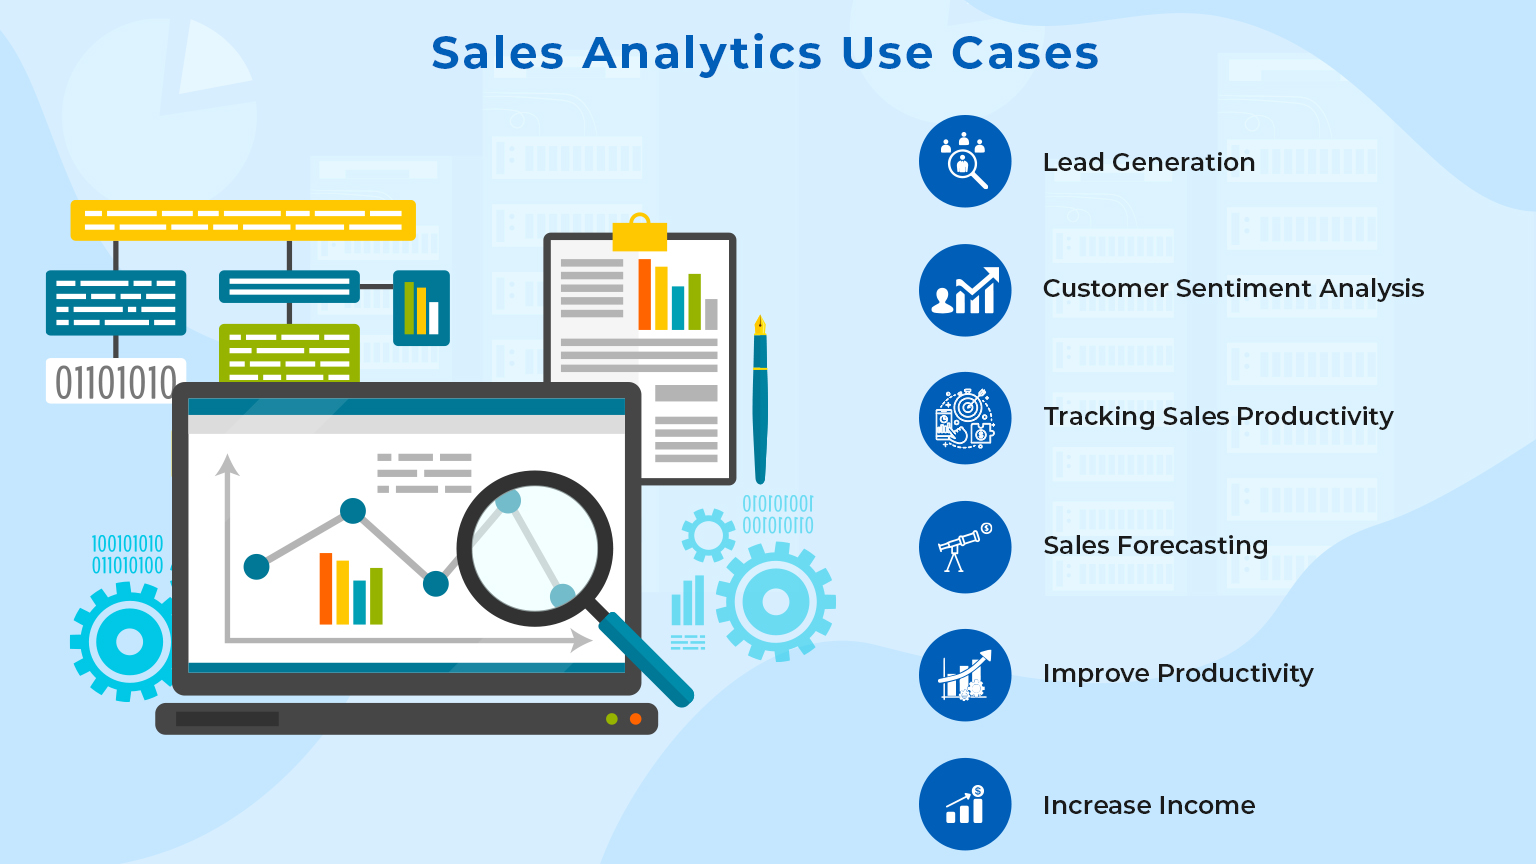
Sales analytics is not just about tracking sales KPIs. It’s about harnessing the power of data to drive sales growth.
From lead generation and customer sentiment analysis to tracking sales productivity and forecasting, sales analytics can be a game-changer for your business.
And with tools like Power BI, creating insightful sales dashboards has never been easier. Power BI offers real-time updates, seamless navigation, controlled user access levels, and AI-powered capabilities.
It’s a one-stop solution for all your sales analytics needs.
Sales analytics is a game-changer for sales teams. It uncovers crucial trends, offers deep data insights, and improves forecasting accuracy. Here are few key benefits:
Why Sales Analytics and Reporting are Important for Organization
 There’s much more to sales analytics than just keeping track of sales KPIs. Here are some of the most critical areas where sales analytics help:
Sales dashboards are a modern way of keeping your sales team in sync so that you can avoid shoulder tapping, missed emails, and extended communication chains.
Over two-thirds of a sales representative’s time (64.8 percent) is spent on non-revenue-generating tasks, leaving only 35.2 percent for selling functions. Your sales staff doesn’t need to waste time hunting for information when they have so many essential obligations to focus on.
Reps spend less time hunting for information and more time on the duties they were recruited to accomplish with the help of a sales dashboard. It can also help salespeople understand their departmental and individual sales goals and determine how they compare to their peers.
It also gives businesses the knowledge and data to target hot prospects and improves their chances of closing a contract.
Power BI Tools allows users to receive insights immediately with a simple setup, no training required, and dashboards for services like Salesforce, Google Analytics, and Microsoft Dynamics.
Publication and sharing of reports simplified:
Publication and dissemination of reports are simplified within Power BI. Analysts upload reports and visualizations to the Power BI service rather than emailing or placing these on shared discs. When the fundamental dataset is modified, its data is regenerated.
Real-time updates:
As data is sent or streamed in, dashboards change in real-time, allowing viewers to solve issues and uncover possibilities instantly. Factory sensors, social media sources, and anything else that gathers time-sensitive data can be used as streaming data sources.
Seamless App Navigation:
Report developers can adjust navigation to assist users in discovering material quickly and understanding the links between different reports and dashboards using the “app navigation experiences” feature.
Controlled User access levels:
Customization of security features is possible. Report developers implement row-level security (RLS) access filters to guarantee that users only see data that is relevant to them, reducing the danger of individuals accessing data they shouldn’t.
Power BI Connectors:
Power BI comes with inbuilt data connectors, enabling organizations to connect with the Power BI system securely. Through this secure connection, the organization can perform robust analytics, create Power BI reports and perform other Power BI services. There are hundreds of available data connectors which can be done, some with customization capabilities as well.
AI-powered capabilities:
AI stands for Artificial Intelligence. Power BI includes image recognition, text analytics, and the ability to create machine learning models and interface with Azure Machine Learning.
The importance of reporting, business insights, and sales analytics grow as a firm expands.
By using modern sales analytics & dashboards, the entire sales management, which covers the performance of the team, sales opportunities, closed deals, and various other sales KPIs, become simplified and easier to follow.
At Beyond Key, we have created a set of curated Sales Analytics dashboards capturing all the important sales KPIs your team needs to skyrocket sales.
Our sales dashboards cover insights on 360-degree Sales Analysis, Sales Leads Analysis, Sales Comparison, Performance, Forecast, and other custom reports and dashboards.
Our Sales analytics solution is powered by Power BI and can easily integrate with your existing CRM or any system to derive quick results. It is fully customizable as well. Contact us for a demo on our Sales dashboards!