Organizations deal with lots of data regularly. But in case you are not able to access or connect with that important data, you are not yielding anything. You are keeping your organizations away from getting the value. This is where Microsoft Power BI comes into play. It helps you solve this problem of Data visualization and sharing on time. In this blog, you can find some of the best Power BI Use Cases and examples that can help in your business.
Power BI is the business intelligence component of the Microsoft Power Platform, enabling users to visualize data from Dynamics NAV or Business Central instances along with many other systems, including Facebook, Google Analytics, SharePoint, and website analytics.
One of the biggest advantages of this tool is that the desktop version of the software is free, which means even small businesses on a tight budget can benefit from the visualized data.
Now let’s understand what Power BI service and its types are.
Power BI services
Power BI service is a secure Microsoft-hosted cloud service that lets users view dashboards, reports, and Power BI apps — a type of content that combines related dashboards and reports — using a web browser or via mobile apps for Windows, iOS, and Android.
There are three types of Power BI that you will see on the Power BI pricing page: Power BI Free or Desktop, Power BI Pro, and Power BI Premium. Check out our blog post: Free vs. Paid Power BI
Organizations usually ask us how we can use Power BI easily or what kind of visually appealing dashboards and reports can be created to make informed business decisions? Beyond Intranet is a Microsoft Gold partner company which is working on BI and data analytics tools and technology for the last more than a decade.
We have developed several intuitive dashboards and reports which are consumed every day with different people in the organization playing various job roles.
Here are a few of the use-cases where Power BI dashboards and reports can make a difference in the angle of seeing data.
1.Resource Management
2. Financial reporting
3. Sales scorecard
4. Claims, billing, and collection report
5. Inventory optimization
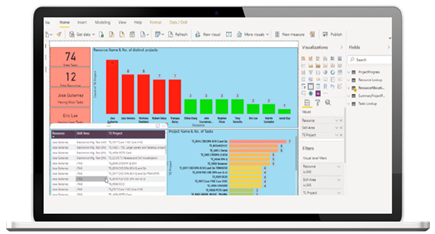
1. Resource Management
We had a leading consumer electronics manufacturer as our client who had multiple productions and device manufacturing sites in various geographical locations.
They needed a Custom BI dashboard to make better decisions on task and resource allocation. We suggested they use Power BI instead of the usual SSRS reports because of the strong visualization capabilities of Power BI. We used the Power Query and Power Pivot in Excel to generate the report. To get a complete overview of resource demand and allocation, we can track key KPIs like:
1. Number of open projects and resources allocated
2. Resources with task count
3. Skills of the resources
4. Project completion percentage
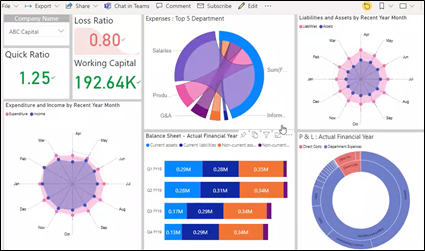
2. Financial reporting dashboards
No matter whatever business you are in, generating revenue and profit is probably your organization’s chief KPI. Tracking your finances with longstanding excel sheets or logbooks is not only difficult but confusing also. You manually keep updating the figures in the cells and eventually tend to lose track. Modern-day businesses have therefore switched to the powerful data visualization tool called Power BI.
We recently developed a PoC of a Financial reporting dashboard for one of our medical devices’ clients. With the unified dashboard, the company could easily understand their complex financial spreadsheets. The got the bird’s eye view of what’s going on with their revenue statements and could take quick decisions on cash flow and product wise sales summary data.
3. Sales Scorecard
The Sales Scorecard is one way we help people to monitor the pulse of their business. The scorecard or the dashboard helps the sales team to have a high-level understanding of what happened with the business the previous day and where things are tracking for the year.
Managers can view the complete scorecard of their team and apply required filters like comparing zone wise sales team performance.
They can slice and dice reports by looking on to the individual team member’s scorecard, product-wise performance, or even geography or time-wise sale. Sales and marketing scorecards are required in almost all types of businesses and we know that customizing it as per your need is equally important to give required output. We are open to any time of customization as well as providing you the self-service Power BI dashboards too.
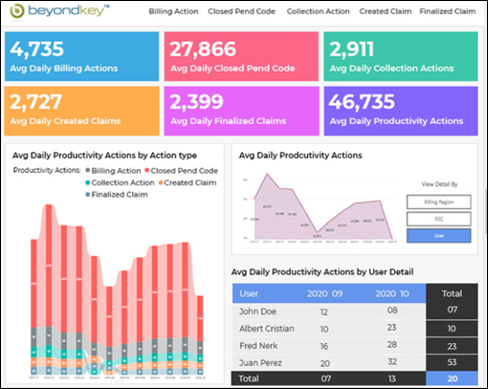
4. Power BI for Claims, billing, and collection report
Speedy and effective claims handling is the basis for great customer management. Power BI can help to improve the claims management process in any industry dealing with claims. The analysis helps identify trends in claims, loss patterns, and helps reduce the risk of fraud and ineffectiveness.
The claims handlers’ team can optimize the claims and billing process, minimizing losses, and increasing customer satisfaction by speeding up the entire process. Other than this, claim cancellation and delay in the collection are two major issues that need to be addressed immediately to keep the customers satisfied and to bring the required efficiency in the process.
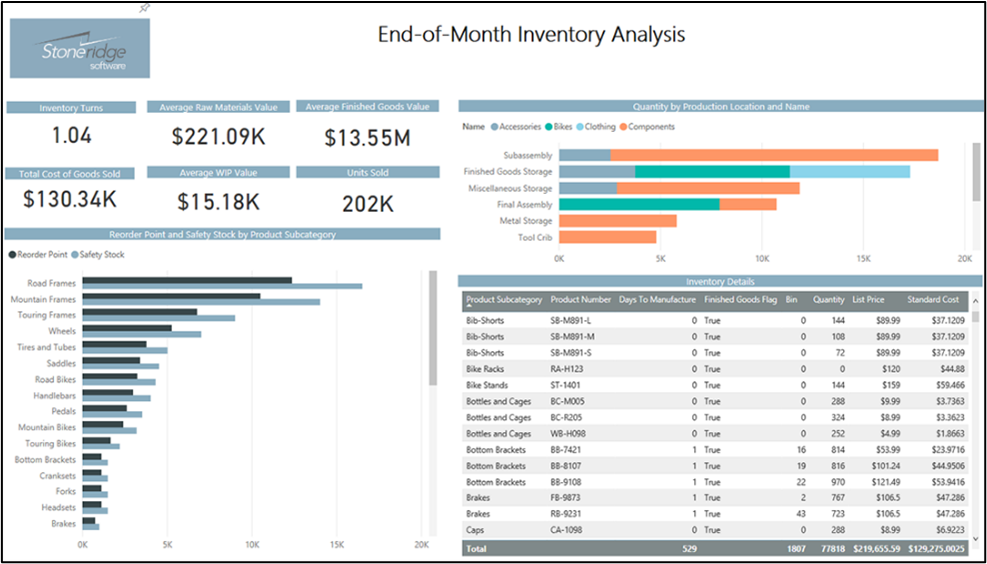
5. Power BI for Better Inventory Optimization
Power BI help identify stock turns, inventory-to-purchase ratio, slow-moving stock, and gross margin return on investment (GMROI) by manufacturer, device, or location.
Through these granular reports created on Power BI, the Inventory head can easily identify how much stock is available for a product. They can do the required sorting of the stock with the manufacturing and expiry dates, prices, and batch numbers.
Power BI’s inventory management dashboards provide:
Power BI Use Cases: Final Thoughts
If you are considering the implementation of any BI platform for your business, we would advise you to at least give Microsoft Power BI by Microsoft. If anything, you can use the free desktop version which also has a lot of potentials. Even if you are facing any difficulty assessing the platform, we are here to help with our Power BI consulting services. We are your full-service BI solutions partner, assisting through all stages of the BI process from exploration to development, deployment, training, ongoing support, and ultimately your continued success.
To learn more about Power BI or our Power BI consulting Services, click the link below or contact us—we would love to help.