Most contemporary businesses operate online, collecting large datasets in the process. The market, customers, and sales data serve as invaluable tools, empowering businesses to recognize trends and make informed decisions.
However, datasets are typically so large that it’s impossible to find patterns or draw useful insights from them. A business can have all the data in the world but will not gain anything if it fails to understand it.
Furthermore, most business users do not have a deep understanding of data collection and organization as data scientists do.
This is where data visualization comes into play. It helps draw insights from data in a way that any business user can understand. Data visualization tools (or “data viz tools”) have become ubiquitous in workflows across industries and verticals.
The data visualization market was estimated to stand at USD 8.85 billion in 2019 and is projected to nearly double in size by 2027.
But what is data visualization? And how can a business pick the right data visualization tools?
We break it down for you in this post.
Data visualization involves representing data from a dataset in a visual form, such as graphs and charts, allowing people to draw insights easily. Additionally, the visual format makes the data more accessible.
Data visualization tools facilitate a simple approach to creating visual representations of data.
These tools are geared to deal with datasets that have millions of data points and automate the process of visualizing data – at least partly – making the data visualization designer’s job more manageable.
Data viz tools serve various purposes, facilitating the creation of everything from dashboards and marketing material to investor slide decks and sales material.
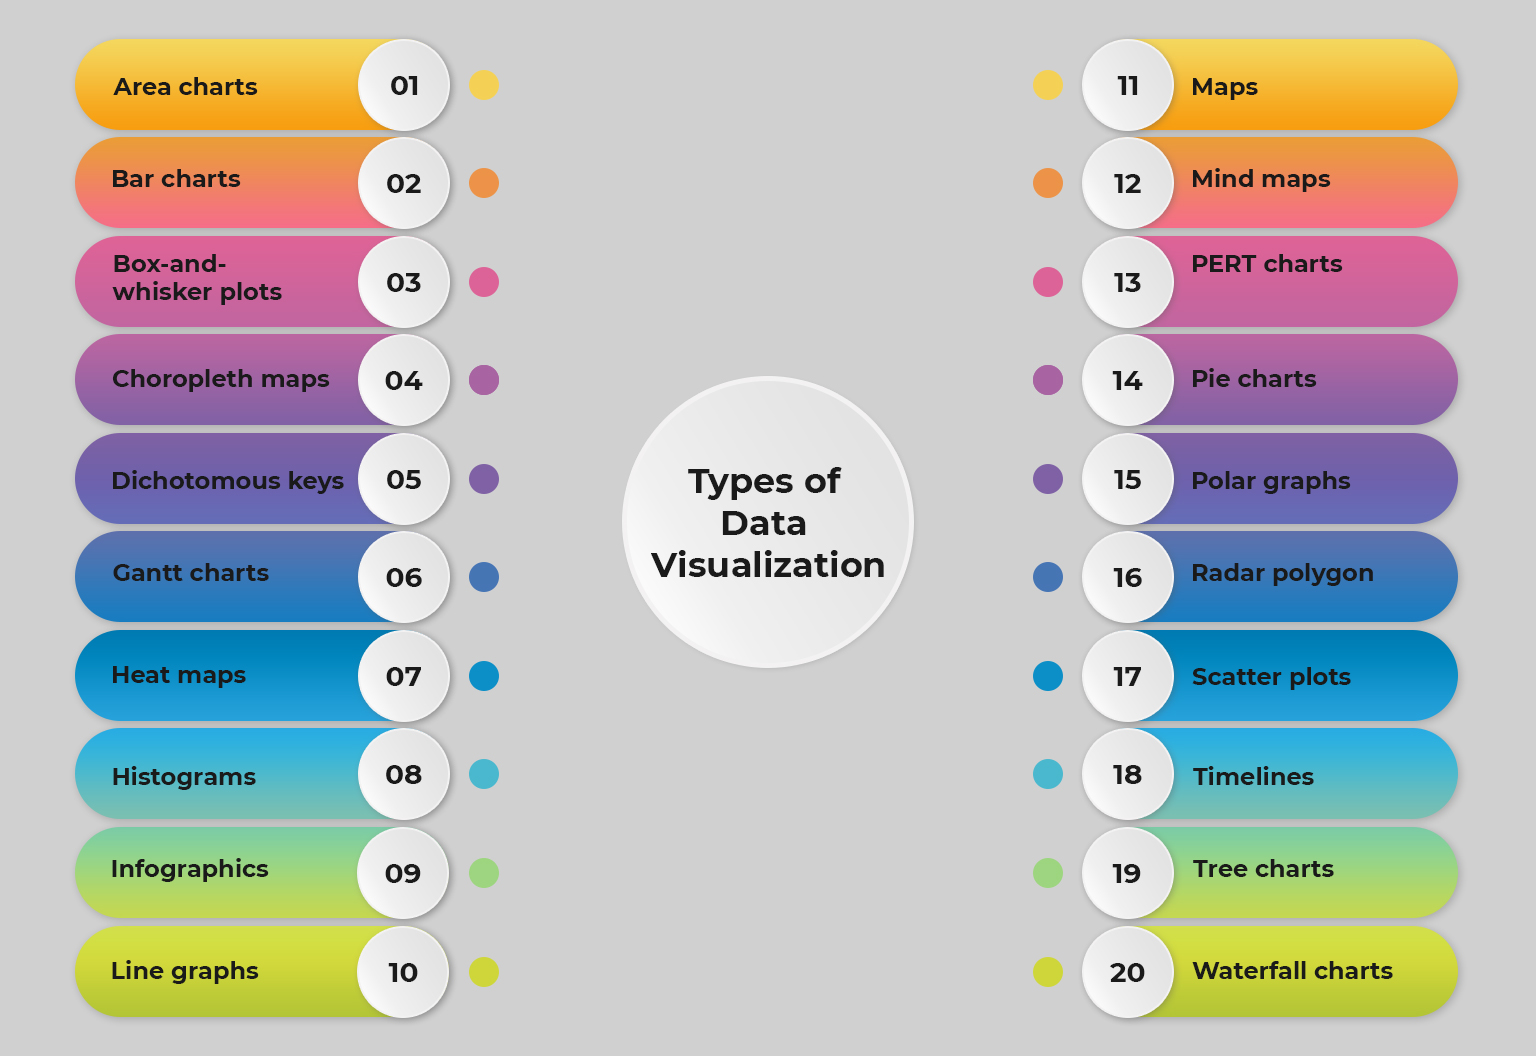
There are hundreds, if not thousands of ways to express data visually, so data visualization is of several types. The most common types of data visualization include:
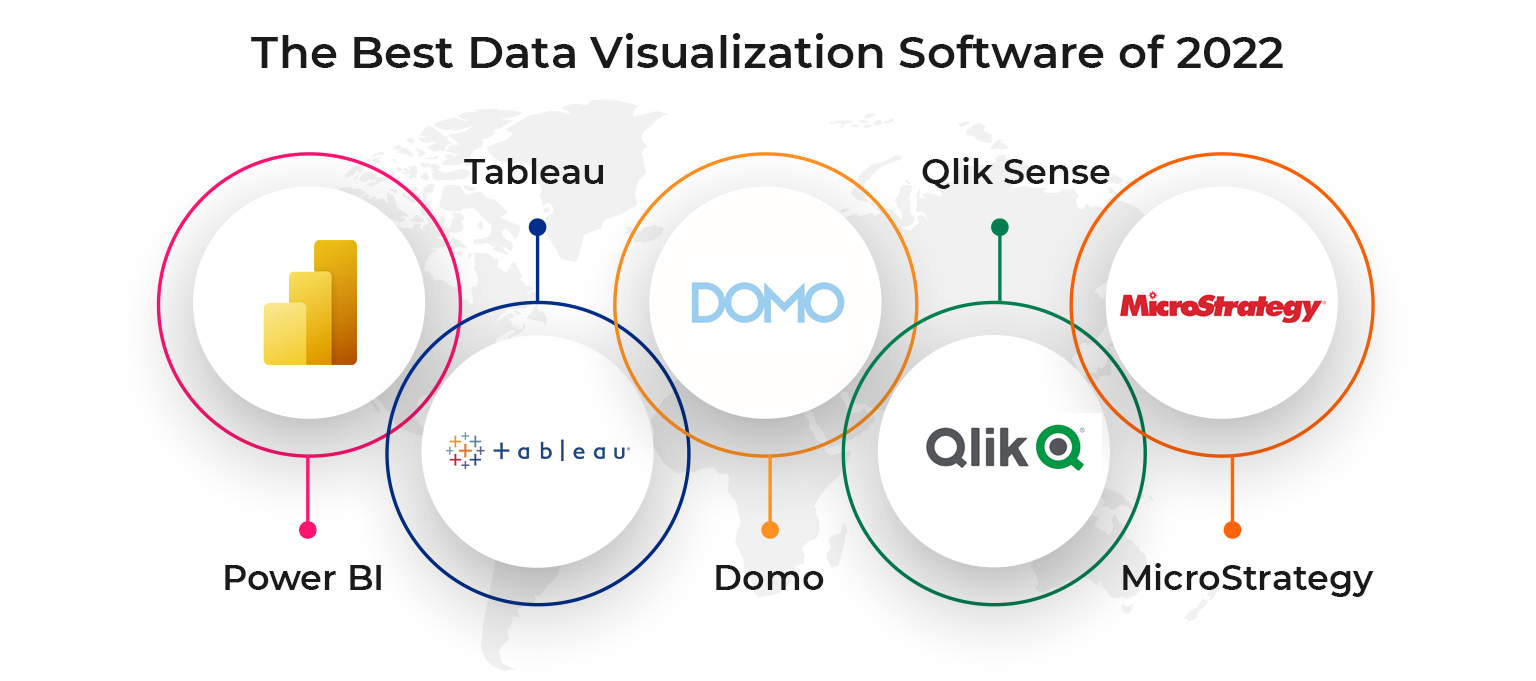
Considering the pricing, ease of use, security, customization, export options, and support, we shortlisted some of the best data visualization tools below.
1. Power BI
Microsoft Power BI is one of the best-known tools in the data visualization market for visualizing business intelligence data. It facilitates self-service analytics, predictive analytics, and reporting for more than 200,000 businesses worldwide.
What’s more, Power BI offers an end-user platform, making the process of report creation and insight sharing straightforward. The tool effectively becomes the centralized repository of your business’s data, and all users of the organization can access the data.
Power BI integrates with tools such as MailChimp, Office 365, and Google Analytics and with hundreds of other softwares in a few clicks, making it convenient for business users to incorporate it into their workflow easily.
With 15 + years of experience and consultation with Beyond Key’s team, you can meet your visualization needs on Power BI without hiring an internal team.
2. Tableau
Popular data visualization tool Tableau is known to offer a convenient way to create interactive charts and graphs by directly fetching the data from various connected data sources.
Offering hundreds of data import options, Tableau can work with CSV files, Salesforce data, and even Google Analytics data.
You can use Tableau as a desktop app, hosted on a server, or use the free public option that offers limited functionality. Designers can quickly create color-coded maps showing off geographical data in a format that’s much easier to understand than a table or chart.
While Tableau is relied upon by hundreds of thousands of businesses, the free public version is used by everyone from journalists to students. Bear in mind that a Tableau Creator license is required to publish data sources and reports.
Anyone who wants to quantify the data of their life – be it a freelance web developer showing off key site performance statistics or a runner wanting to track and visualize their progress – can use the tool.
The large gallery of infographics and visualizations on the public version can greatly help anybody looking to visualize data.
But it’s important to note that the public version does not allow keeping your data analyses private.
A seasoned designer will not have much trouble picking up how the tool works. However, the plethora of video tutorials makes it easy for anybody to
learn using Tableau.
Whether your business needs attractive and interactive dashboards or your industry demands detailed reports, Beyond Key has got you covered.
With over 16 years in the data visualization industry and dozens of satisfied clients, Beyond Key creates solutions that are perfect for a business’s needs. Browse our data visualization consulting services page for more details.
3. Domo
Rather than a data visualization tool, Domo is a business intelligence model comprising several data viz tools. In other words, it is a consolidated platform that facilitates data analysis and the creation of interactive data visualizations.
Domo makes combining text, images, and cards in the dashboard a breeze, allowing you to walk others through the insights the data provides.
It allows you to import data from over a thousand sources and enables users to work with over 250 million rows of data.
But no desktop version is available – Domo is offered on mobile and cloud environments. Beyond Key can handle your Domo visualization tasks for you.
Domo comes with pre-built dashboards, allowing you to obtain insights from the data quickly. You can try the tool for free by signing up for the trial, which is an excellent avenue to get a feel for the platform before making any commitments.
4. Qlik Sense
Featuring an associative data analytics engine, a sophisticated AI, and scalable multi-cloud architecture, Qlik Sense is a leading self-service visualization, discovery, reporting, and analytics platform.
The platform enables fast and reliable visualization creation, deep analysis of data, and identification of new opportunities. It is one of the many data visualization tools the Beyond Key team consults for.
Combining, loading, visualizing, and exploring data becomes intuitive with Qlik Sense, regardless of the size of the dataset. Every visualization you create on Qlik Sense updates instantly according to the current data context.
Additionally, the Qlik Sense AI supplies data insights and enables you to create analytics by straightforward dragging and dropping. Qlik Sense Business is free for 30 days, and you can get a feel for it before committing to making it part of your workflow.
Read our comparative analysis on Power BI vs Tableau vs Domo vs Qlik
MicroStrategy is a BI tool best known for offering reports nearly instantly. The tool boasts an intuitive interface, allowing you to view an array of documents from the home page.
The multiple-window interface allows for easy comparison of data points while helping you keep an eye on the big picture.
More impressively, the tool downloads all the content you’re working with onto local memory, allowing you to work when you’re on the move without an internet connection.
The library web feature allows you to connect to multiple libraries simultaneously. It is one of the most effective tools Beyond Key offers consultation for.
Visualization tools are not one-size-fits-all solutions, and every tool on the market has a distinct USP. You will need to do your due diligence to find the right tool, gauging whether the features offered meet your needs.
Your choice of data viz tool will largely depend on your skills, goals, and resources. Here are the five factors to consider when choosing a data visualization tool
Some visualization tools offer robust feature sets and complete configuration controls. Developers and data analysts use these tools for advanced analytics and detailed visualization design.
However, tools with several features cannot be used by business users.
Other data viz tools are built with an emphasis on ease of use, allowing non-technical users to get started without much hassle.
That said, these toned-down tools may not provide fine-grained analytics and as much control over the visualization’s design.
Tools geared towards visual analytics provide several data analysis capabilities and improved analysis speed. Exploration of data in this way allows analysts to find patterns and insights from the data.
But these data viz tools are typically used by data analysts and scientists working with several data sets.
On the other hand, tools geared towards data storytelling are designed to facilitate easy data communication between people. These tools aid users convey their ideas and insights to a target audience.
Tools emphasizing the explanation aspect of visualization are used by subject matter experts, consultants, and business users.
Some data viz tools enable application and dashboard creation according to the data and insights. Consultants and business users use these features to create visual components that function together and convey a broad array of information.
In contrast, independent visualization tools let you create one chart at a time, with each chart working with individual data sets.
Students, journalists, PR professionals, and marketers often use these tools to create visualizations and embed them on websites.
Some data visualization solutions are designed as data platforms. These platforms emphasize visualization features for new users and sometimes also feature data management and modeling features.
Data platforms are designed to help entire organizations visualize data
On the other hand, some companies offer solutions focused on visualization, and these tools only serve that singular function. These are used by teams with access to data sources that need a straightforward data visualization tool.
Data visualization tools are typically provided on subscription-based access, with most tools demanding a monthly fee. However, some visualization tools are free with limited features.
You can also find tools that are free for public visualizations or sign up for a free trial of a tool before deciding to purchase a subscription.
Contemporary businesses embrace data-driven strategies, and with abundant data available to capture, brands can find easy ways to understand their customers and communicate their message effectively. No matter what business or field you are, data visualization services can help you paint a clear picture of your growth story. With Data analytics and visualization experts working for us, we have all-round capabilities to help you choose the best data visualization tools which can be fit to your organization. Our list of top data viz tools coupled with our purchase guide should help you find the right tool for your business. Alternatively, you can visit Our Power BI consulting page to get in touch with professionals who can handle your BI requirements.