Power BI is the Business Intelligence component of the Microsoft Power Platform which provides us appealing dashboards and reports. These dashboards can easily be created using simple drag and drop functions. Many organizations face challenges with Power BI report performance while accessing these reports. Our Power BI team has researched a lot on improving and optimizing the Power BI report performance issues using tools like the Performance Analyzer tool.
Windows Performance Analyzer (WPA) is a tool that creates graphs and data tables of Event Tracing for Windows (ETW) events that are recorded by Windows Performance Recorder (WPR) or Xperf. WPA can open any event trace log (ETL) file for analysis.
Let us walk through the steps of how we can use the Performance analyzer tool to analyze the performance of Power BI reports.
In Performance Analyzer, we can identify how the report elements, such as visuals and DAX formulas, are performing. We can see and record logs that measure how each of your report elements performs when users interact with them in MS (milliseconds).
Duration (MS) = the difference between a start and end timestamp for each operation.
Now, let’s deep dive into how the Performance Analyzer tool works.
Remember, this feature is available on Power BI Desktop only
Let’s get started.
1.Open your Report (pbix file).
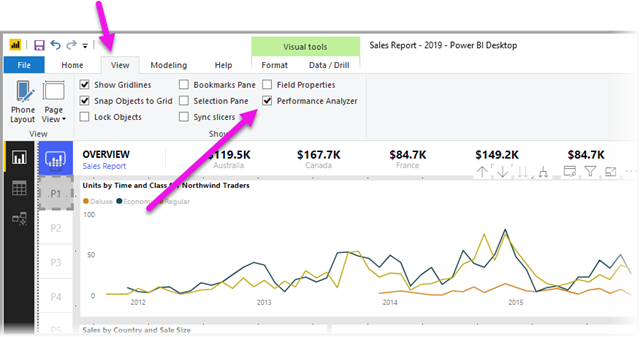
2.Select the View In the Show area of the View ribbon, you can select the checkbox next to Performance Analyzer to display the Performance Analyzer pane.
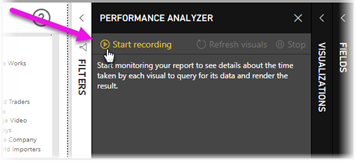
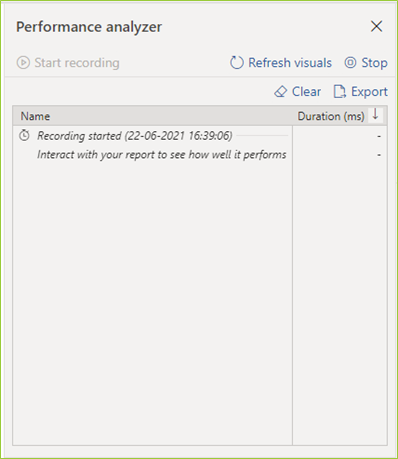
Once we click on Performance Analyzer, the below image pane will appear.
3. Click on ‘Start recording’. Clicking on “Start recording” this will be in running mode.
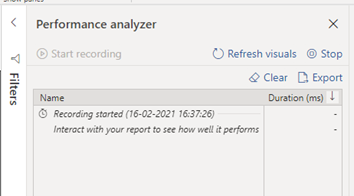
4. Start doing your operations on the report where you are facing issues and all other required areas to check for report performance.
Keep in mind, any actions you take in the report are displayed and logged in the Performance Analyzer pane.
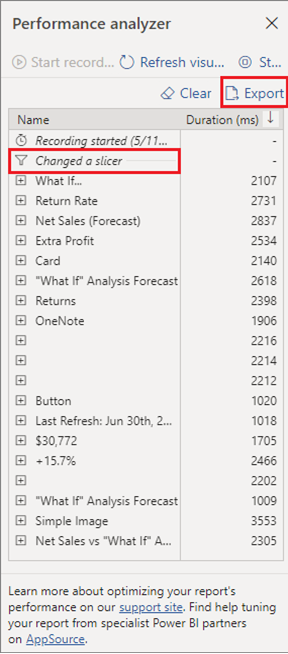
So, each time you click on a visual, move a slicer, or interact in any other way, Performance Analyzer immediately displays the performance results in its pane.
5) Once you are done with the report element review you can select the Stop button which is now enabled.
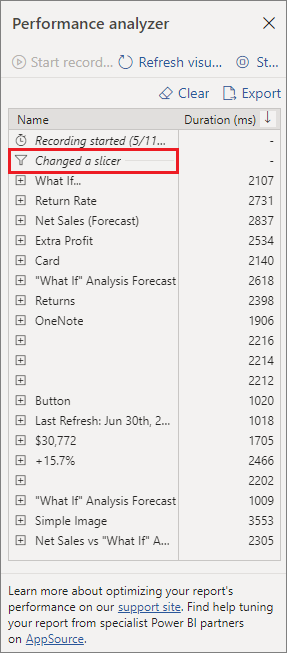
6) Now all recorded information can be viewed directly in the pane or you can export it in JSON format.
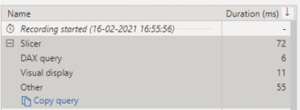
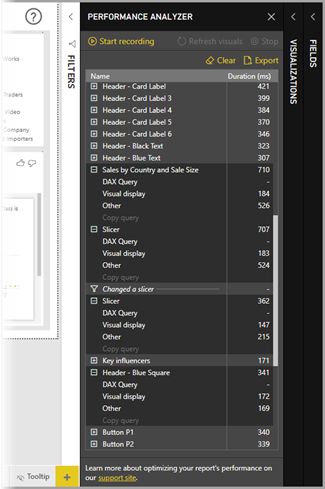
Performance Analyzer recording analysis will be done on the following categories:
You can identify the duration (in milliseconds ) for each element.
The Performance Analyzer feature is the perfect tool to use if you have slow models. We have put together all the steps you need to follow within Performance Analyzer to boost the performance of your BI models and reports.
If you face any difficulties or issues with controlling the performance of your BI reports, feel free to get in touch with us. At Beyond Key, we have a team of skilled Power BI consultants who can help you quickly resolve such issues in no time. Simply write to us at [email protected] to reach us.
Also, visit our website to know more about our Power BI consulting services and offerings.