-
Core Technologies
Core Technologies
![Core Technologies]()
Beyond Key ensures that our technical skill set is always up-to-date with the most current and latest technologies to support and enhance delivery capabilities.
-
Emerging Technologies
Emerging Technologies
![Emerging Technologies]()
Beyond Key's journey into Voice, IoT, and digital transformation aims to revolutionize the work process of current and future clients.
-
Services
Services
Beyond Key excels in consulting with experience and delivering tailored, contextual solutions to complement your company’s goals on a variety of platforms.
-
Solutions
Solutions
![Solutions]()
Beyond Key delivers cutting-edge business solutions that help you simplify and streamline your complex business processes in any department.
-
Industries
Industries
![Industries]()
Beyond Key is adding value to your business based on our cross-industry expertise.
-
Our Insights
Our Insights
![Our Insights]()
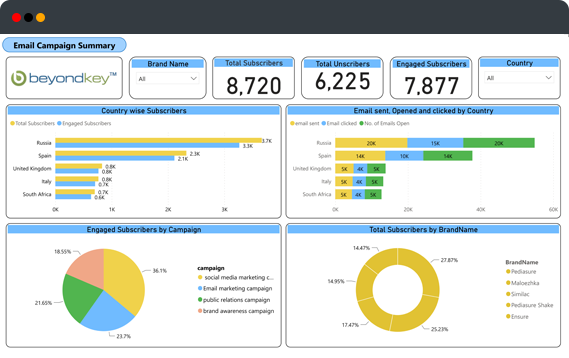
Beyond Key provides access to a full-fledged library of curated content elaborating on our client case studies, technological processes, customer experience resources, and relevant tech news.
-
Company
Company
![Company]()
Beyond Key is a leading software development and IT consulting company, specializing in custom solutions and leveraging transformative Microsoft technologies. With a sharp focus on AI, we utilize Microsoft technologies, including SharePoint, Teams, Dynamics 365, and Power Platform (Power BI, Power Apps, and Power Automate). Our innovative methodologies and expertise give businesses a decisive competitive edge.