
Capturing Value from the Data and Insights
Effective planning, customer satisfaction and value are three key mantras for success in any business but to an even greater degree in the medical device manufacturing industry. And business intelligence is the best way to find a competitive advantage and helps the companies get quick and effective results to make it happen.
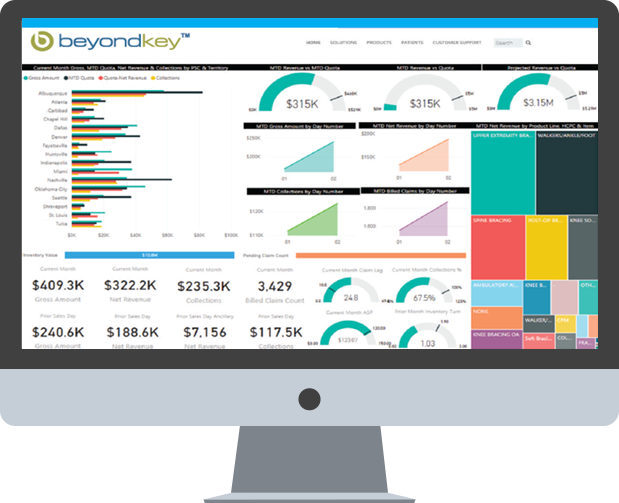
The key to growing your sales is through leveraging the data your medical device company collects into visually appealing and insightful dashboards and reports.
If you are in the process of identifying how to set up these reports, let us help you leverage the best BI solutions for your specific needs.

-
Sales

- Identify Sales oppurtunities
- Customer Buying Intends
- Cross selling and upselling oppurtunities
-
CEO

- Overall Company performance
- Self Service BI
- Future trend reports
-
CFO

- Crucial Financial Reports
- Trend Analtyics for budgeting
- Hoc reports and data
-
Inventory & Orders

- Stock analytics
- Order fulfillment and trackability
- Budget planning for procurement
-
Claims, Billing & Collection

- Daily billing and Claim tracking
- Account wise collection reports
- Employee wise Commission reports
Identify sales opportunities within the existing customer base
According to Gartner, 80% of CEOs claim their data is an asset. At the same time, only 10% say their company treats data this way.
Tracking sales data can reveal opportunities to grow revenue and prevent challenges to your bottom line. Sales team can easily track customer’s purchasing intent and thus they can do better planning for upcoming opportunities. Detailed sales analytics can align their future campaigns to specific customers without wasting lot of time.
Business Intelligence Tools provide quick insights like:

What are the most and least popular devices?

Customer’s buying intentions and habits

Forecasting and aligning future sales approach
Reports that can get your financials at your fingertips
As an executive at a medical device company, it is important to have quick access to your company’s key financials like your P&Ls, balance sheets, growth charts, and revenue dashboards.
You need to see the big picture for your entire organization. With data captured from various sources, often stakeholders struggle to access these reports. The right BI integration and migration capabilities help you leverage data from your legacy systems with more current data sources into unified dashboards.
With smart BI solutions, it is possible to cut down report publishing time to half of the previous time taken.
Executives get quickly access to:
- Unified dashboards with meaningful and intuitive reportss
- Data lying in your legacy systems and use it to build meaningful reports
- Self- service reports and dashboards with minimum technical intervention
- Quickly identify how your sales revenue customers, and products are performing and identify risk areas.
- Trend analytics on customer accounts and geographies to improve budgeting and planning
Dashboards and reports tailored to different user roles and self-service BI
Power BI reports and dashboards are meant for catering to analytics which are custom build as per the specific requirement for each title in that industry. E.g., a Vice President of sales would need to see the global sales dashboard with different filters like geography, accounts, products, and sales representatives while a sales manager may need to see a drill down into the sales reports for his zone or sales team.
Power BI also has self-service reporting capabilities which can be created often without a technical team.
You get benefits like:
- No technical dependency for creating reports
-
Slice and dice data with several permutation and combination till
you get the exact analysis of information by evaluating:
- What happened
- Why it happened
- What is the future impact?
- What is the next action plan?

Identifying opportunities with Cross-selling and upselling
Efficient sales and marketing cannot survive without effective cross-selling and upselling strategies. Cross-selling demands your sales team to have a clear understanding of products that can work well together. You can leverage these BI solutions to analyze the sales performance of these products.
Upselling is the art of getting clients to buy a higher version of any product than they currently use.
You get quick information like:
- Products purchased together multiple times.
- Customers purchase intent and habit
- Fostering close relationships with customers and adding loyalty through discounts and offers.
- Sales Pipeline dashboards and opportunity dashboard help get more statistics on real-time analytics of sales.
- Easily track target metrics dashboards, order fulfillment, claims, billing and collection dashboards, and Power BI trend dashboards.

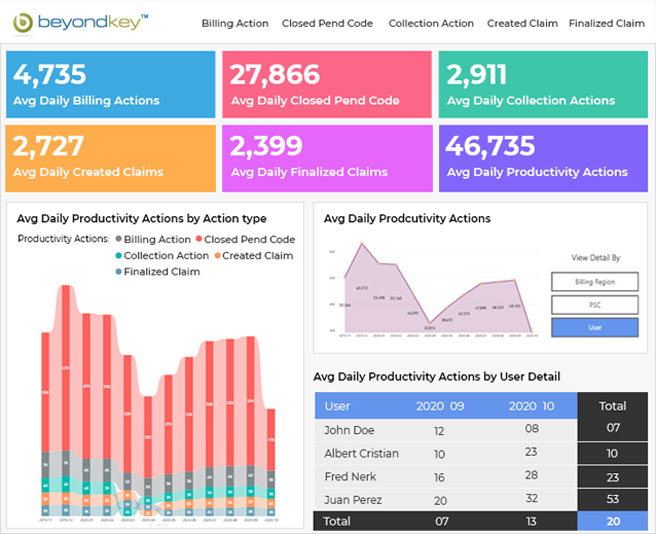
Streamlining Claims, Billing and Collection reports
Speedy and effective claims handling is the basis for great customer management. BI can help to improve the claims management process in any medical device industry. The analysis helps identify trends in claims, loss patterns, and helps reduce the risk of fraud and ineffectiveness.
The claims handlers’ team can optimize the claims and billing process, minimizing losses, and increasing customer satisfaction by speeding up the entire process. Other than this, claim cancellation and delay in collection are two major issues that need to be addressed immediately to keep the customers satisfied and to bring the required efficiency in the process.
BI reports help to gain better insights like:
- Granular reports on total claims entered, billed and overdue
- Reports related to policies, the premium paid, and total revenue.
- Predictive reports to figure out claims’ cancellation or delay in collections.
- Detailed Accounts receivable (AR) reports
- Patient Vs Insurance collection reports
BI for better inventory management.
BI help identify stock turns, inventory-to-purchase ratio, slow-moving stock, and gross margin return on investment (GMROI) by manufacturer, device, or location.
Through these granular reports created on BI platforms, the Inventory head can easily identify how much stock is available for a product. They can do the required sorting of the stock with the manufacturing and expiry dates, prices, and batch numbers.
BI’s inventory management dashboards provide:
- Granular reports on Overstock, Understock, and deadstock
- Insights into product/ raw material purchases and re-stocking / re-ordering
- Plans to eliminate the deadstock and bring overall efficiency with stocking
- Reports to track and monitor inventory in multiple warehouses.
- Procurement budgeting and planning across multiple warehouses

Progress on Order fulfillment and trackability (DIFOT)
Delivery in full on time (DIFOT) is one of the key matrices which gives you the measures on how often the customer gets what they want on the time. Meeting purchase requirements is the key to customer retention and tracking. DIFOT helps you excel at order fulfillment and the new orders inflow. By doing this right, you can increase customer satisfaction.
Our BI solutions show you when DIFOT occurs and when it doesn’t. You can drill down and discover which products prevent you from the DIFOT, and then take appropriate measures to fix the problem.
DIFOT information includes:
- Appropriate stock levels to fulfill orders
- Order tracking by geography and sales representatives
- Customer retention and satisfaction rates
- Short term cash requirements for upcoming stock re-order programs.
- Key vendors analysis and procurement
- Which opportunities to discontinue


Resources

Healthcare Analytics and its impact on Hospital Performance
“The Global healthcare analytics market is projected to reach USD $50.5 billion by 2024..
Compare the Top BI Tools: Power BI vs Tableau vs Qlik vs Domo
How smart are your organizations’ decisions? Do you have the right information..

Why your Nonprofit need Data Analytics and BI dashboards?
Data has the potential to become a powerful addition to the work you do, providing..
Predictive Analytics for Policy Cancellation
We helped a leading insurance company to leverage power of Predictive Analytics to help them reduce policy cancellation rates.

BI Enablement for NPO
We helped a leading healthcare and family center NPO with custom BI dashboards and reports to help them with data visualization and timely reports by integrating with their existing EHR system.
Data Visualization for Healthcare
We helped a leading Non-Profit Healthcare center with custom BI dashboards and reports to help them with data visualization and timely reports.
Power BI: Powerful ways to make your data speak
Every company needs feedback. From the fledgling entrepreneur to the large Fortune 500 companies..


