
Medical Device Company gets powerful data visualization using Business Intelligence solutions.

- Medical Device manufacturer
- California
Client Background
Our Client is a California based medical device company specializing in providing orthopedic bracing. They have more than 2000 clinics and over 6000 orthopedic surgeons. The company has over 1800 employees and sales of approximately US $100 million.
Business Situation
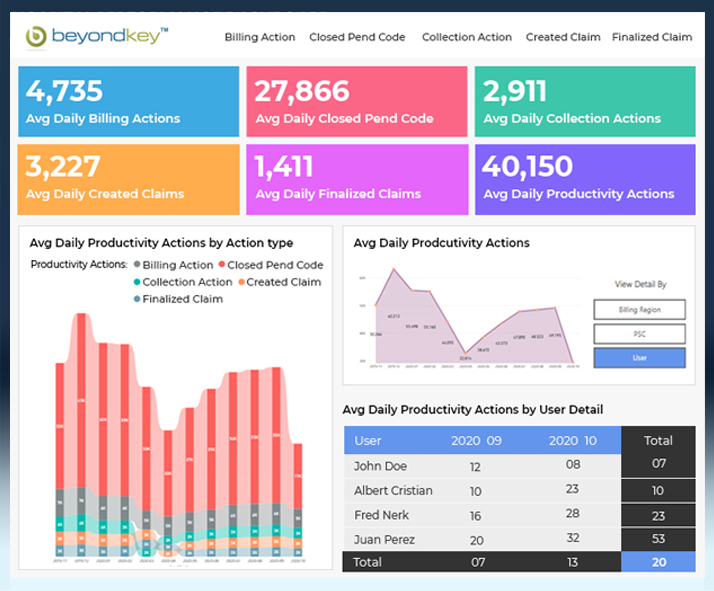
Our US-based client lacked visibility into its vast data collected from disparate sources. Key people from different departments lacked insights to keep track of order deliveries, sales, claims, billing, collection, and inventory. There were no unified dashboards to refer and basic reports took days to be published.
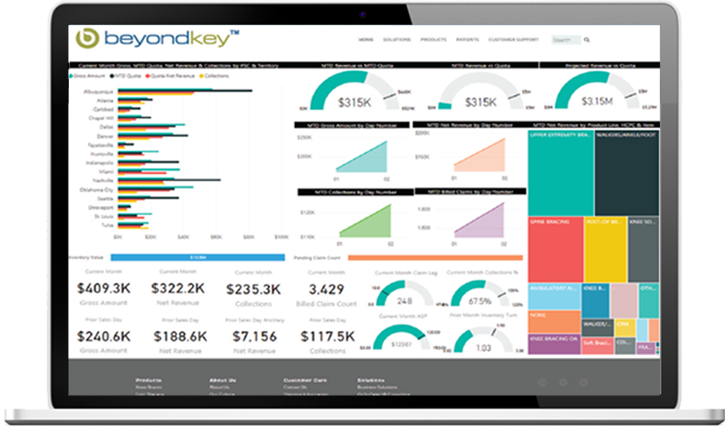
Solution
We created an Enterprise grade Data Warehouse to the client’s core system to cater to all the canned, ad-hoc, and analytical reporting needs. Our team recommended an architecture to unify data from a disparate system, data modeling was done to minimize the report building and turnaround time from a day to seconds. The legacy data system was also migrated into the latest SSRS and cube reports.

Microsoft BI: SSIS & SQL Server
We created 1000+ SSIS packages that get the data from source as ORACLE, SQL Server, Files Systems (CSV, EXCEL & TXT), MDS, COGNOS & Third-Party APIs.

Data Warehouse
Build Data Warehouse & Mart to support all sorts of reporting needs. Using our Strong Data Modelling capabilities, we created a robust architecture for them.

SharePoint & SSRS
Created 1000+ SSRS reports for different modules that are managed by the SharePoint server.

SSAS: CUBE & Tabular
Build SSAS OLAP Cubes / Tabular Cubes to support thousands of measures for complex analytical reporting.

Azure Services & Power BI
Used Power BI as Analytics tool because of its rich visuals and moved to Azure Cloud platform.
Benefits
- The client achieves an effective BI solution at half the cost of an alternative.
- The Reports using cube data are very handy for the people at all levels within the company as they can get a clearer picture of past, current, and future trends.
- Report publishing time has cut down by 75% than earlier.
- Ad-hoc reports and self-service has given the company stakeholders a competitive advantage.
- Migration from Cognos saved them on costs and efforts.
Resources

Healthcare Analytics and its impact on Hospital Performance
“The Global healthcare analytics market is projected to reach USD $50.5 billion by 2024..
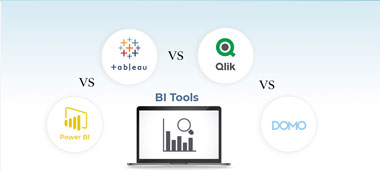
Compare the Top BI Tools: Power BI vs Tableau vs Qlik vs Domo
How smart are your organizations’ decisions? Do you have the right information..
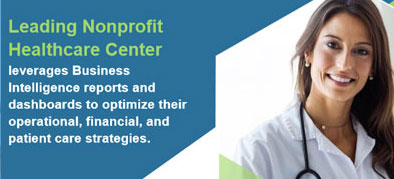
Why your Nonprofit need Data Analytics and BI dashboards?
Data has the potential to become a powerful addition to the work you do, providing..

Predictive Analytics for Policy Cancellation
We helped a leading insurance company to leverage power of Predictive Analytics to help them reduce policy cancellation rates.
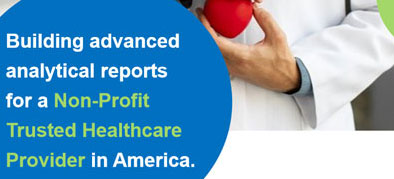
BI Enablement for NPO
We helped a leading healthcare and family center NPO with custom BI dashboards and reports to help them with data visualization and timely reports by integrating with their existing EHR system.
Data Visualization for Healthcare
We helped a leading Non-Profit Healthcare center with custom BI dashboards and reports to help them with data visualization and timely reports.
Power BI: Powerful ways to make your data speak
Every company needs feedback. From the fledgling entrepreneur to the large Fortune 500 companies..


