
HR Analytics
These are challenges Beyond Key's HR data analytics dashboards are built to solve.
Let’s Talk About Your HR Data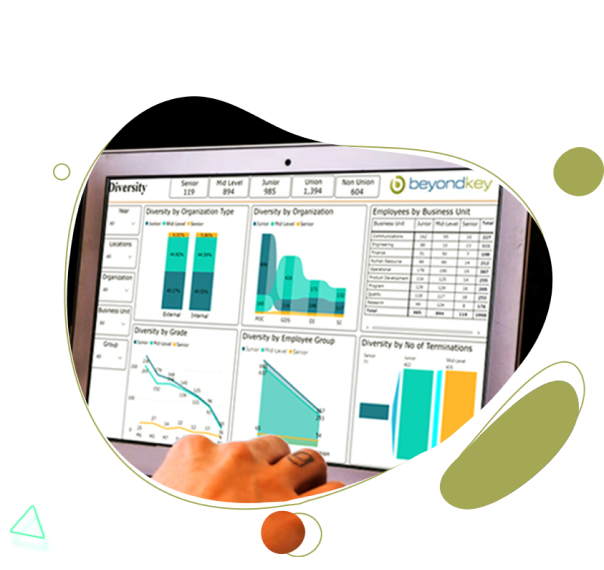
Custom Dashboards That Match Your Business
Every business has unique KPIs, and your HR data analytics should reflect that. Whether it’s tracking time-to-hire, analyzing turnover, or measuring training effectiveness, our HR analytics dashboards are fully customized to the metrics that matter to you.
You define the priorities. We deliver the insights.
Our HR Analytics Dashboard Samples

Executive Summary Dashboard
- Executives need clarity—fast. Our HR analytics dashboard consolidates critical metrics into a single snapshot. Headcount, diversity, turnover—everything your C-suite needs for quick, informed decisions.
- Track workforce performance and recruitment progress at a glance.

Demographics Dashboard
- Diversity isn't just a goal, it’s measurable. Our HR and data analytics breaks down your workforce by gender, ethnicity, age, and job function.
- Spot trends, identify gaps, and make diversity more than just a talking point.

Diversity Dashboard
- Diversity is a business imperative. Our HR data analytics services provide a clear view of where diversity efforts succeed—and where they don’t. Track gender and ethnic diversity across your organization with HR data analytics.
- Understand today’s landscape. Forecast tomorrow’s trends. Adjust in real-time.

Open Position Dashboard
- Manually tracking vacancies wastes time. Automate it. Our HR data analytics tracks open roles, their duration, and the business units impacted.
- Prioritize hiring more effectively to minimize disruptions and fill critical roles faster.

Filled Positions Dashboard
- Filling roles is just the beginning. With human resource analytics, our dashboard tracks time-to-hire, recruitment sources, and diversity metrics.
- Fine-tune your recruitment strategies with data-driven insights. Optimize every hire.

Termination Dashboard
- Turnover is costly. Our people analytics helps you understand why employees leave, where, and after how long.
- Spot attrition trends early—broken down by gender, location, and tenure—so you can act before it’s too late.

Hiring Dashboard
- Hiring is a strategic process, not just filling vacancies. Our HR data analytics dashboard tracks applicants, costs, and success rates in real time.
- Identify what works in your recruitment process. Improve with data-backed decisions.

Forecast Dashboard
- Can you predict workforce changes? With HR and data analytics, our forecast dashboard gets you close. Leverage people analytics and historical data to plan for future terminations and hires.
Be prepared, not reactive.
Stay ahead with insight-driven planning.
Streamline HR with Our Custom Dashboards
Revamp Manual Reports with Our HR Analytics Services
Are your HR teams still wasting hours pulling data from different systems? It’s time to stop.
Our HR data analytics services automate reporting. No more manual spreadsheets. No more errors. Just accurate, real-time insights at your fingertips.
Imagine what your team could achieve with that time back.

All Your HR Data, Unified in One Place
Your HR data is scattered—payroll, recruitment, performance management. It’s inefficient.
Our service integrates all your systems into one HR analytics dashboard. No more switching between platforms. Just one source of truth for HR and data analytics, giving you a complete view of your workforce.
With clear, actionable people analytics, decision-making becomes effortless.
Safeguard Sensitive Data with GDPR Compliance
Your HR data is sensitive. It must stay secure.
Our human resource analytics platform ensures compliance with GDPR and other regulations. You stay in control. Your data remains protected.
No risks. Just reliable, secure HR data analytics.

KPIs We Help Track with Our Reports

HR Metrics
- Seniority & Function Type: Understand how roles and experience levels impact your organization’s growth and stability.
- Turnover & Absence Rates: Spot trends in employee departures and absenteeism early, so you can take preventive measures.
- Recruitment Cost: Know exactly how much it costs to bring in new talent, and optimize your recruitment spend.

Workforce Management KPIs
- Absenteeism Rate: High absenteeism? It’s not just a scheduling issue. It could signal disengagement or well-being problems. HR analytics can help you pinpoint why.
- Internal Mobility: Internal moves show a healthy talent pipeline. HR data analytics helps you track and grow it. If mobility is low, it's time to rethink.
- Training ROI: Training is costly. Are employees using what they’ve learned? HR analytics services track ROI, ensuring your programs are worth it.

Compensation KPIs
- Labor Cost per FTE: How much does each employee cost? HR and data analytics help you see if you’re overpaying or underutilizing your workforce.
- Pay Equity: Track pay gaps—gender, racial, and more. People analytics can help ensure your compensation is fair and competitive.
- Human Capital ROI: How much revenue is each employee generating? Data analytics in HR measures if your workforce is driving business goals.

Recruitment KPIs
- Time-to-Fill & Vacancy Rates: Empty desks hurt. HR analytics shows how long it takes to fill roles and the impact of vacancies on your business.
- Quality of Hire: Are new hires fitting in and contributing? People analytics helps measure fit and performance from day one.
- Turnover Rate: Why are employees leaving? Human resource analytics helps you find the root cause and fix it.
Ready to Transform Your HR Data?
Turn raw HR data into insights. Drive retention, recruitment, and performance with Beyond Key’s people analytics tools today.


