
Insurance Analytics Dashboard Solutions
Say goodbye to critical pain points in the insurance industry with our custom-built insurance analytics dashboard powered by Power BI.
Request a Demo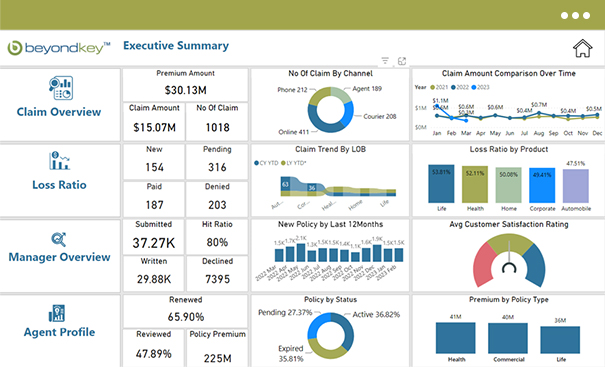
Insurers and intermediaries have a wealth of data that's often locked inside redundant databases and multiple legacy systems, making it challenging to collate all the valuable information into a single source of truth for informed decision-making.
To achieve consistent success, insurance companies must create a data-driven work culture that can help identify profitable customers and manage their entire lifecycle, from acquisition to maturity.
As a team of insurance BI solutions specialists, we've crafted a suite of curated insurance analytics dashboards custom-built to address the major challenges faced by insurers and MGA's. Our insurance dashboard solutions provide a single view of your data, enabling you to gain valuable insights, streamline your processes and make data-driven decisions.


Track and monitor key insurance metrics and KPIs
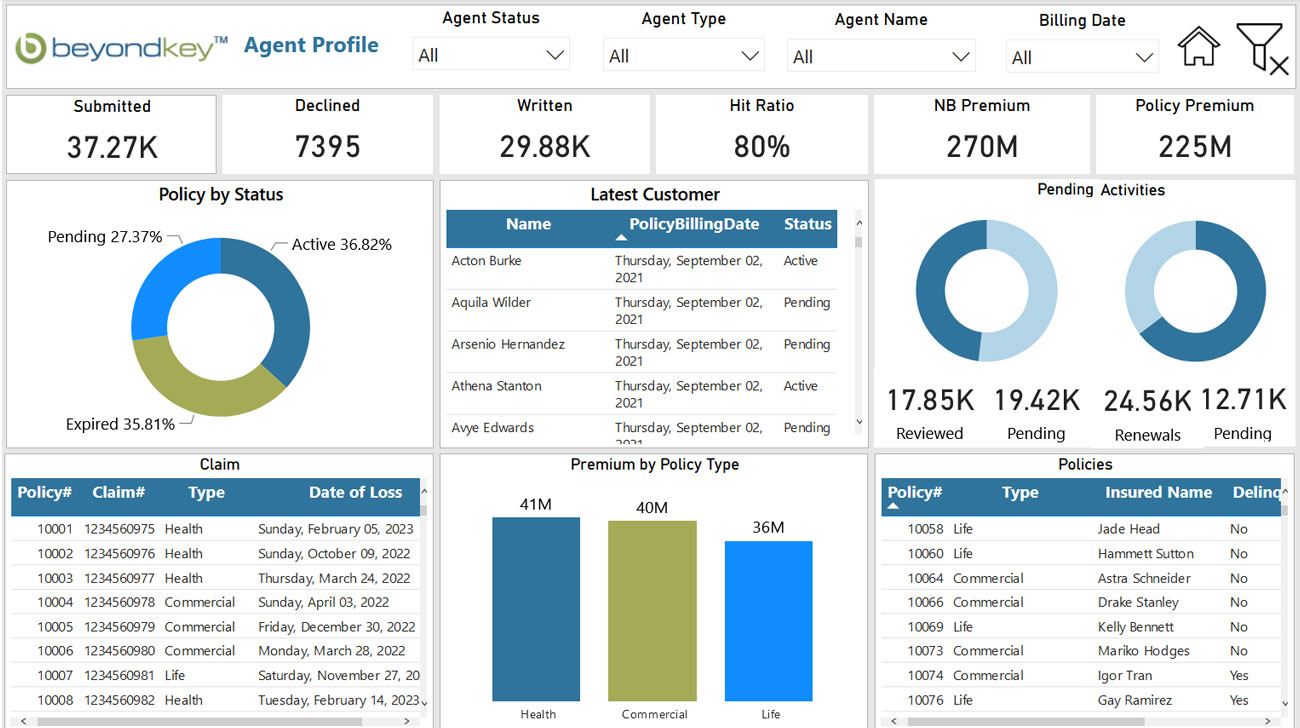
Our insurance dashboard is built with cutting-edge insurance analytics technology, providing you with real-time insights that can help you optimize your operations and make informed decisions. With our customizable insurance dashboard, you can streamline your processes and accelerate your overall profitability. Say goodbye to data-related headaches and say hello to a new level of data-driven success with our insurance analytics dashboard.
4 Key Benefits of having an insurance analytics dashboard solution for your company
Generate more leads & customers
Using our customizable insurance dashboard, insurers can dive deep into their existing customer database, currently scattered across unorganized legacy systems. Visualize your customers' overall journey and optimize your insurance solutions, creating a personalized experience for every potential customer and increasing the number of qualified leads.
Helps in Fraud Prevention
Our insurance dashboard is built on advanced technologies such as artificial intelligence, machine learning, data mining, and predictive modeling, enabling insurers to save up to 70 billion dollars annually that is often splurged into fraudulent insurance claims. Identify patterns of fraudulent behavior from any applicant and detect any false claims before they occur.
Accuracy into Risk Prediction
Leverage the predictive analytics capabilities of our insurance dashboard to presume the risk associated with each insurance application even before issuing a policy. Determine whether the applicant holds any criminal record, forbidding policy issuance beforehand and avoiding any unforeseen risks.
Reduce Costs with Digital Transformation
With our insurance analytics, automate time-consuming manual tasks such as compliance checks, reducing operating costs and streamlining your processes. Create a seamless customer journey with limited operational costs and unlock the full potential of your data. Our insurance analytics dashboard enables insurers to focus on what matters most - creating a customer-centric experience that drives success.
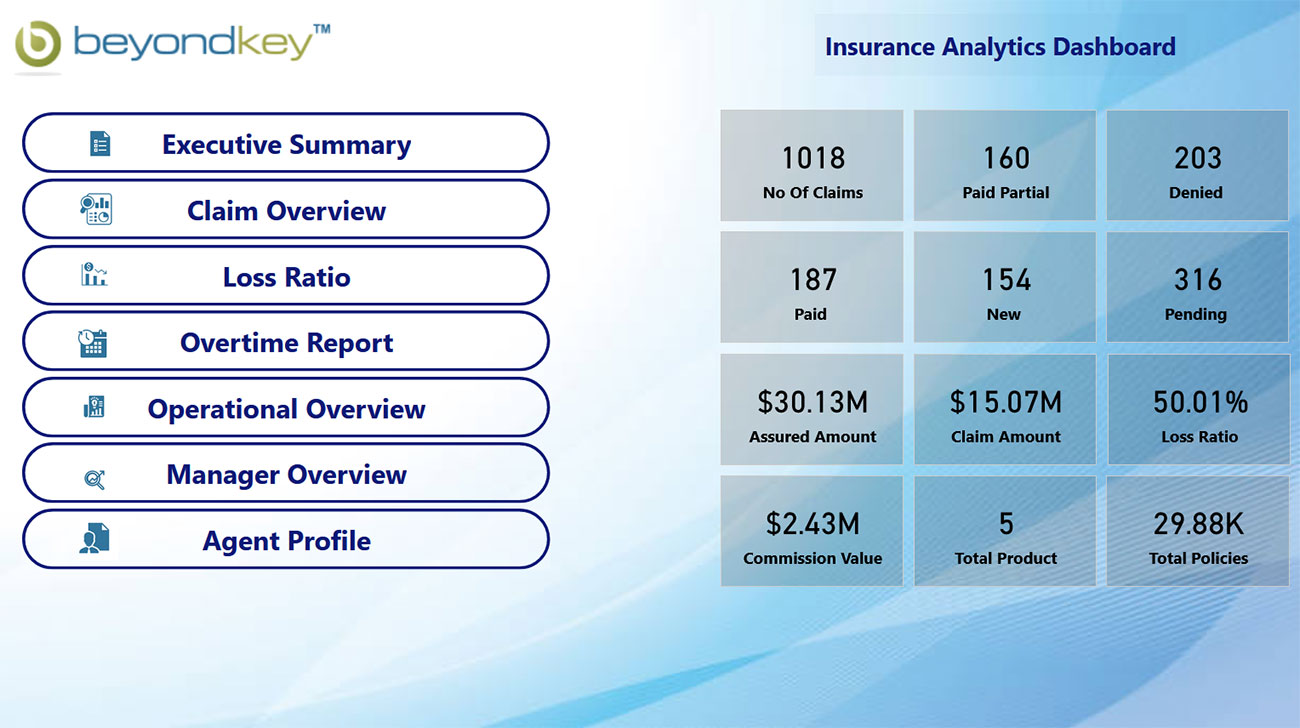
Insurance Analytics Dashboard Examples
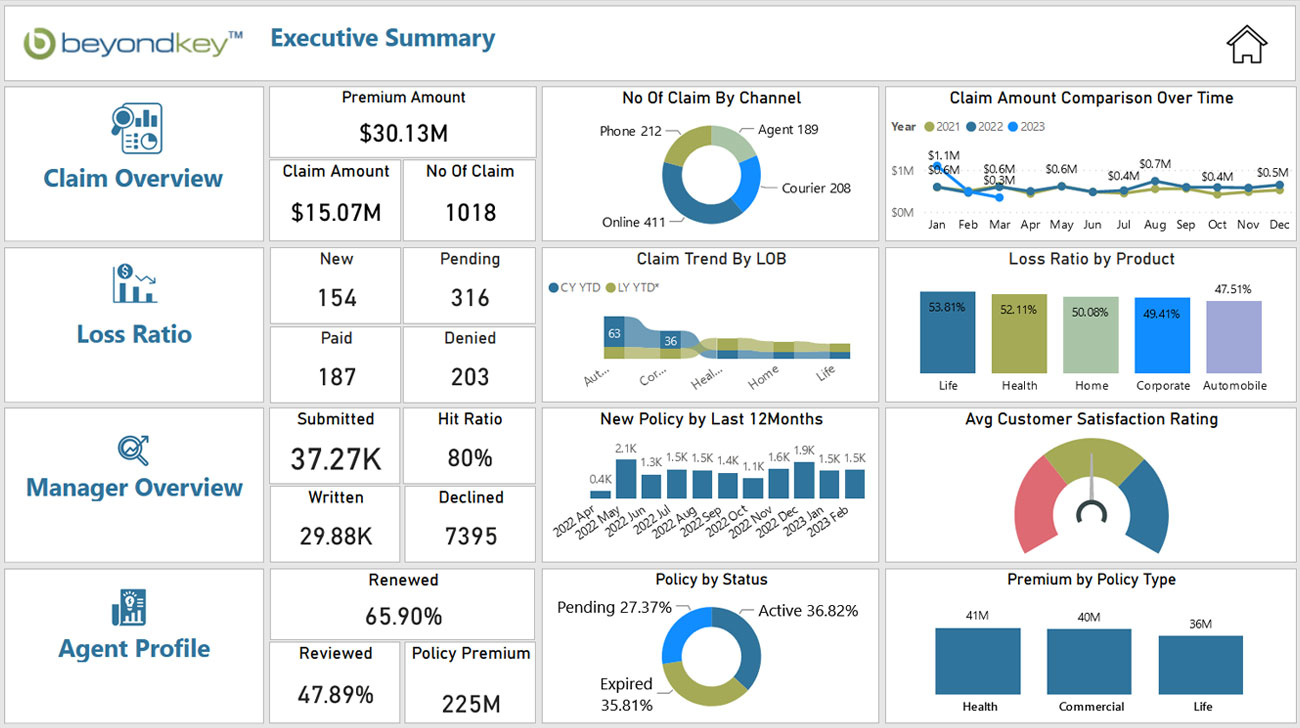
Insurance analytics and visualization dashboards are often used by insurers to track and monitor key insurance metrics and KPIs to obtain deeper insights into their overall company performance
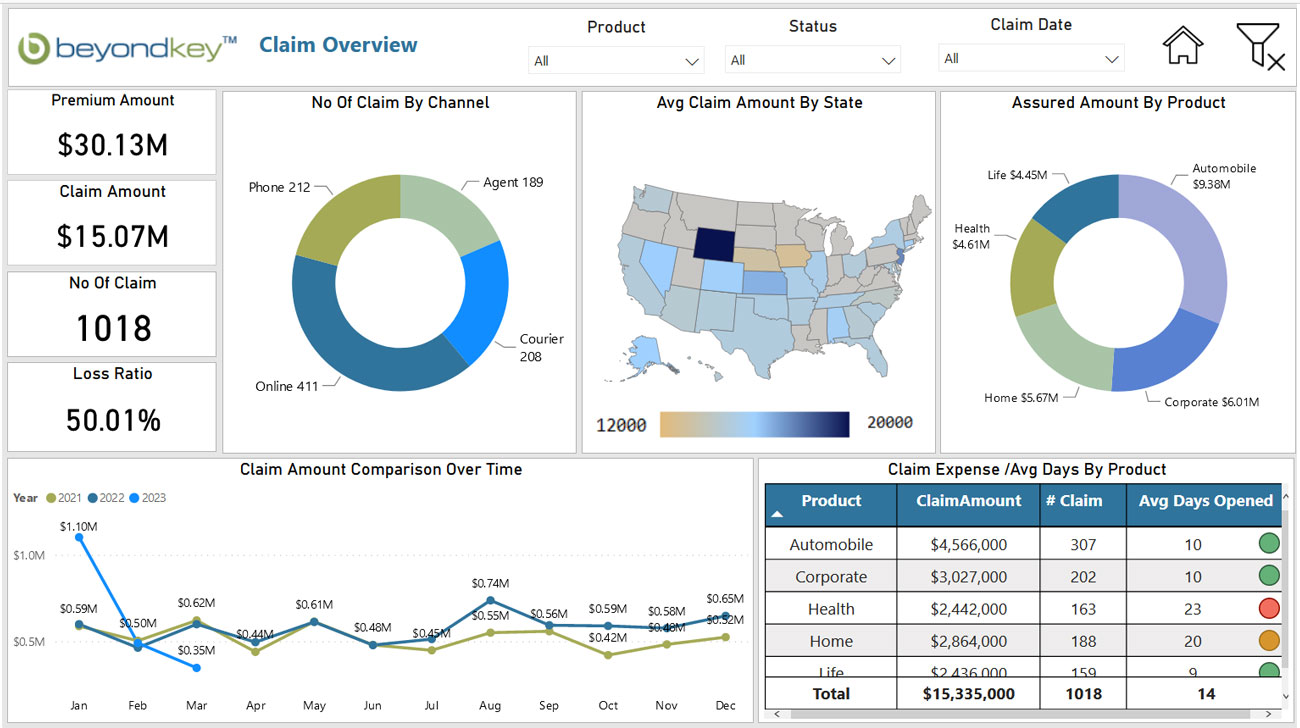
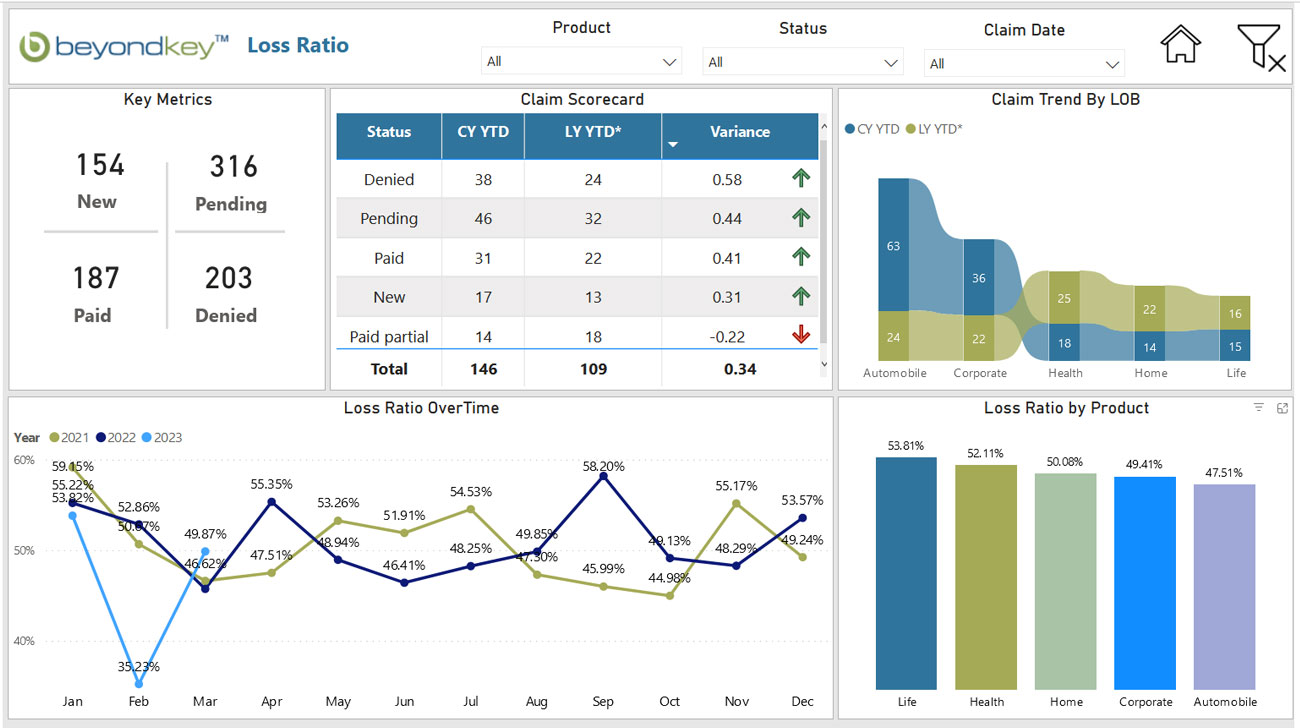
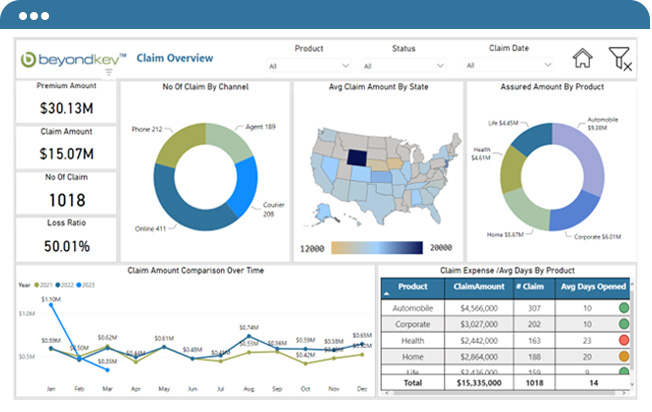
Insurance Claims Overview Dashboard
Gain valuable insights into your insurance company's claim metrics with our insurance analytics dashboard. Track claim volume, average cost over time, average claim amount by state and product, and average processing time to streamline your claims processing and improve overall efficiency.
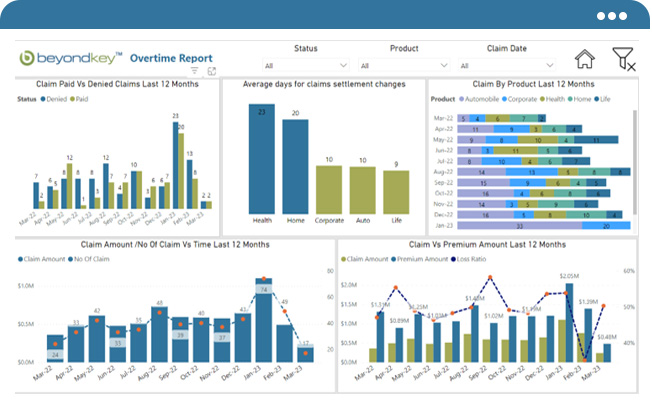
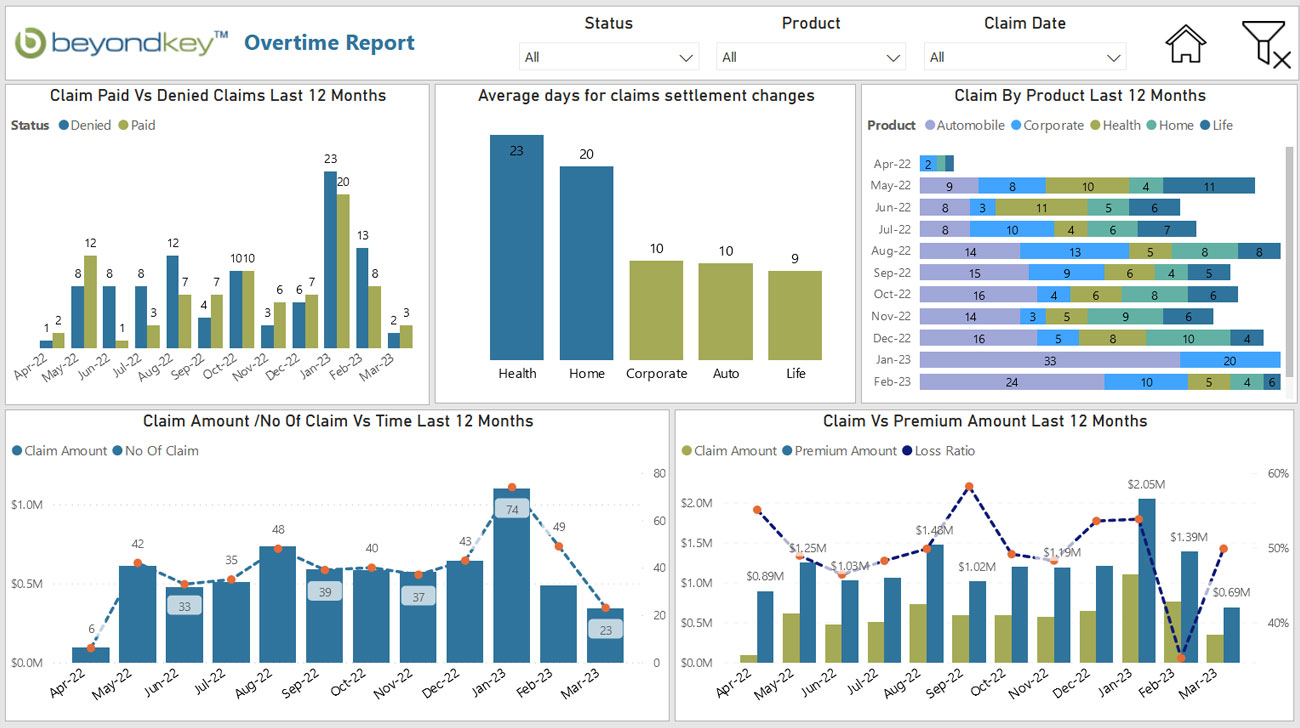
Insurance Overtime Report Dashboard
By leveraging the power of insurance analytics, our customizable insurance dashboard provides an Overtime Report that empowers insurers to compare and analyze their claims data over multiple years. This dashboard allows managers to easily track trends in claims volumes, claims processing times, and other important KPIs, enabling them to make informed business decisions and improve their overall performance.
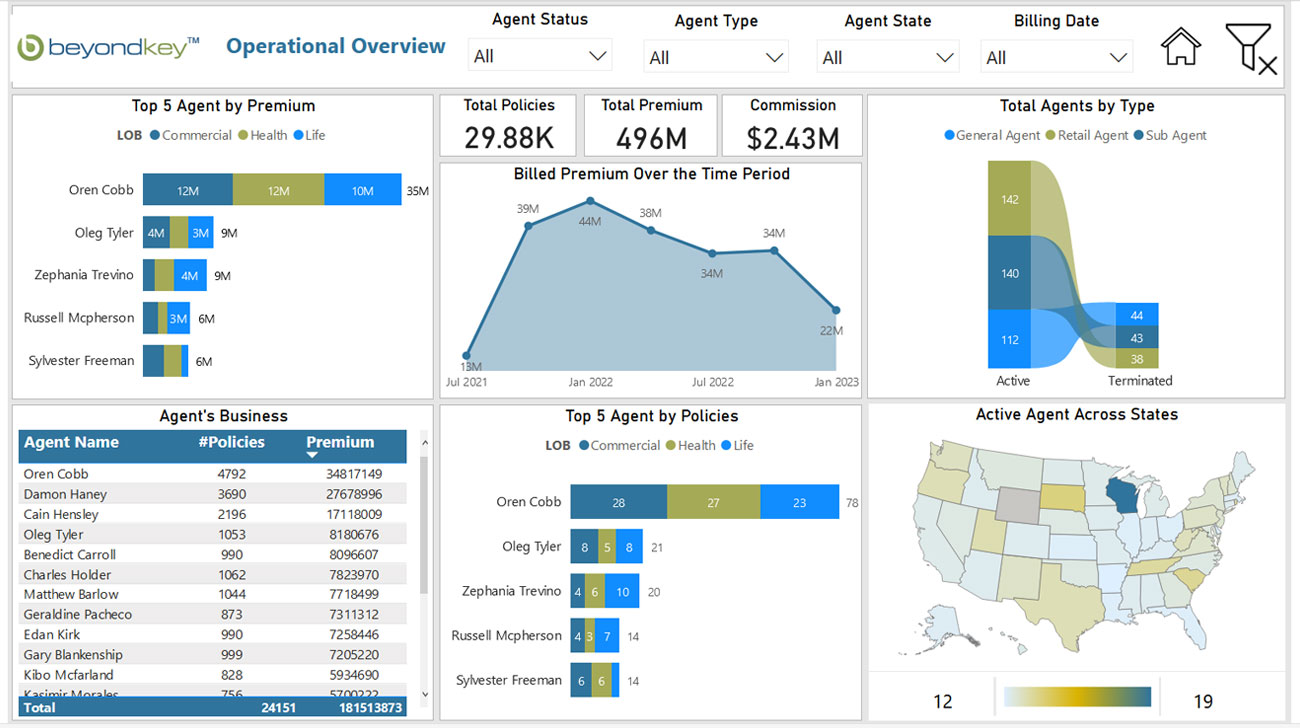
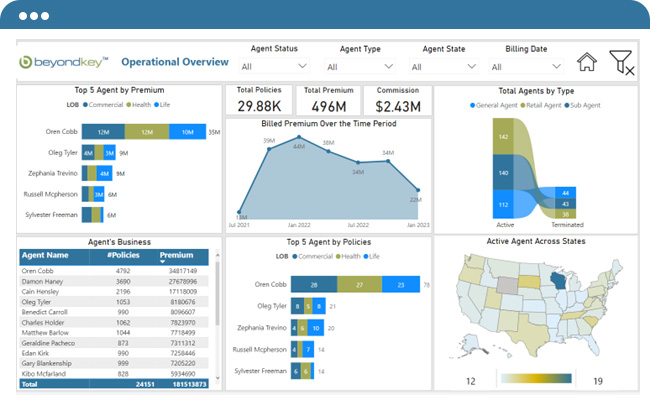
Operational Review Dashboard
This insurance dashboard provides a centralized view of your operations and enables you to track key performance indicators, such as top agents by premium and policies. You can also analyze agent performance across different geographies, allowing you to identify areas where you can improve performance and optimize operations using insurance analytics.
Our Case Studies

Power BI Solution empowered efficient workflow, optimized resource allocation, new growth through actionable insights.
View case studyIf you want a fully customized demo of our entire suite of insurance analytics dashboards
Frequently Asked Questions
-
What is analytics in the insurance domain?
Insurance analytics is the process of analyzing data to gain insights that can be used to improve business processes and decision-making in the insurance industry. An insurance dashboard is a tool that presents this data in a visual and easy-to-understand format.
-
What are the benefits of insurance analytics and dashboards for insurance companies?
Insurance analytics and dashboards can help insurers improve customer satisfaction, enhance risk management, optimize underwriting and pricing, and boost profitability by providing real-time insights into key performance indicators.
-
How does insurance analytics and dashboards work?
Insurance analytics and dashboards use various techniques such as predictive modeling, machine learning, and data mining to analyze vast amounts of data to uncover patterns, identify trends, and make predictions. The insights gained from this analysis are then presented in the form of visualizations on a dashboard.
-
What kind of data is used in insurance analytics and insurance dashboards?
Insurance companies use various types of data, including customer data, claims data, policy data, and third-party data such as weather data, economic data, and demographic data to create analytics and dashboards.
-
What are some examples of insurance analytics and dashboard applications in insurance?
Insurance analytics and insurance dashboards can be used for fraud detection, claims processing and settlement, pricing and risk assessment, customer segmentation and targeting, and product development. By providing a centralized view of operations, insurers can track key performance indicators such as top agents by premium, by policies, and agent's performance across different geographies, enabling them to identify areas where they can improve their performance and optimize their operations.


