
Sales Dashboards & Analytics
Convert more sales opportunities to sales leads with the powerful insights on sales dashboards- 15+ years of domain experience
- 50+ certified professionals
- Cost-effective solutions
- One-stop solution for all your data analytics needs
- Hands of experience with multiple BI tools

What are Sales Dashboard and analytics?
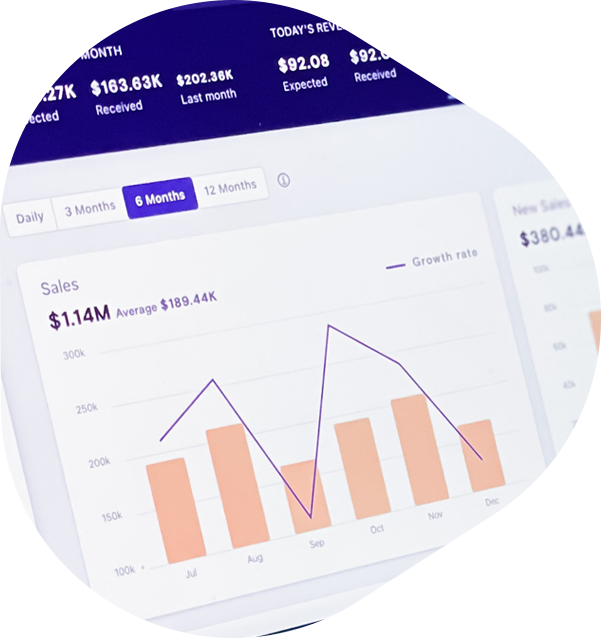
Sales dashboards and analytics are the set of those important KPIs which are required to monitor the sales performance and growth of your company. Monitoring these KPIs help you in improving the sales strategy planning and forecasting for future sales predictions.
Why are the sales KPIs so important?
The sales Team needs dashboards and reports to understand where they stand in their sales goals. From top C-level executives and managers to everyone in the sales team have to go through detailed analyses of sales performance, cycle lengths, and sales funnel. Our customizable sales dashboards come in handy to give you a bird’s eye view of your key sales KPIs.
These dashboards enable your team to have a 360-degree view of your entire sales information like sales, profit, cost, revenue, and sources. They also help you to understand the analytics of your leads. There are specific sales comparison dashboards that help you to compare sales and cost by timeline. Sales performance dashboards help to give detailed insights on how the sales representatives are performing while the Forecast dashboard help to forecast the clause of sales, profits, costs and leads so stakeholders can predict the actions items for the future.
Let us see some of the custom Sales dashboards in action
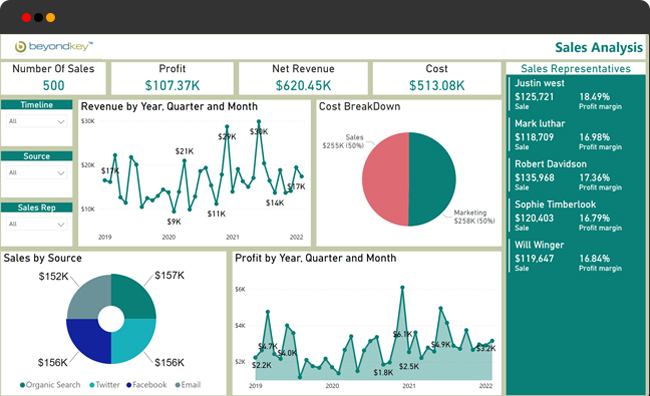
Sales Analysis Dashboard
The sales Analysis dashboard is a holistic dashboard and visualization chart which gives salespeople quick insights into the number of sales, profit, net revenue, and expenses incurred in the given time frame. It also gives overview information of the sales team performance as well as a granular report on revenue and profit by year, quarter, and month. Similarly, it gives insight into sales by source and expense incurred. KPIs of this dashboard are customizable.

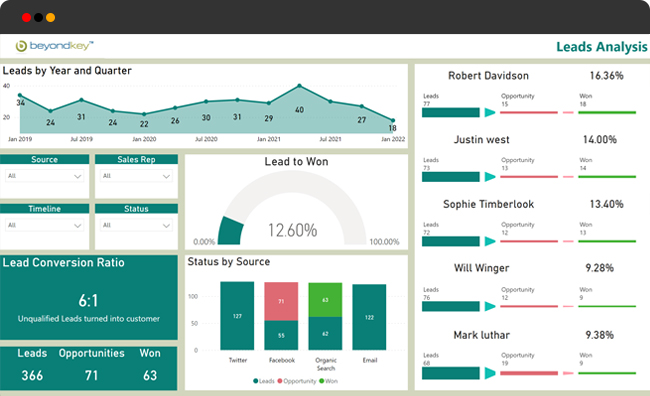
Leads Analysis dashboard
The Leads Analysis dashboard also called the sales to funnel dashboard gives you the entire picture of how leads are flowing in and out of your system. With this visual chart, your sales team can track the number of leads coming in any specific time frame. It also shows metrics of leads won and lost ratio, leads to opportunity ratio, and leads by each sales representative. This helps the stakeholders get a quick idea of the health of the business and the efforts put into each conversation happening on daily basis. It is a dashboard that not only gives granular insights but also helps to drill down into the Leads KPIs to see the possibilities for future improvement.

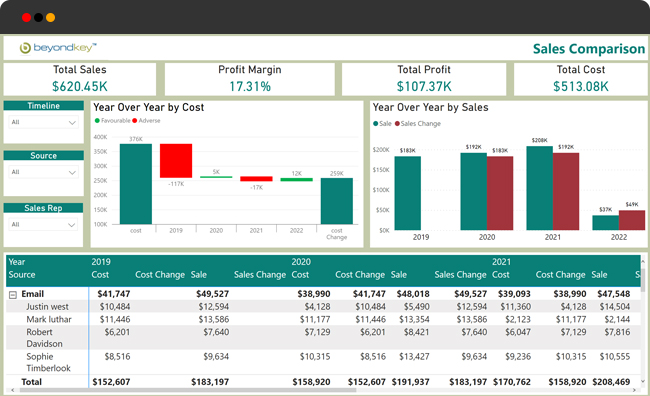
Sales Comparison Dashboard
The sales comparison dashboards give comparative insights like total sales, profit, and expenses year on year or month on month basis. This helps to understand how your sale and the overall performance of your business. Comparison is shown through a bar graph. Along with this tabular data of year on year cost and sales, metrics are also shown to quickly make you understand what’s the pace of your business growth and how it can be escalated further in coming years.

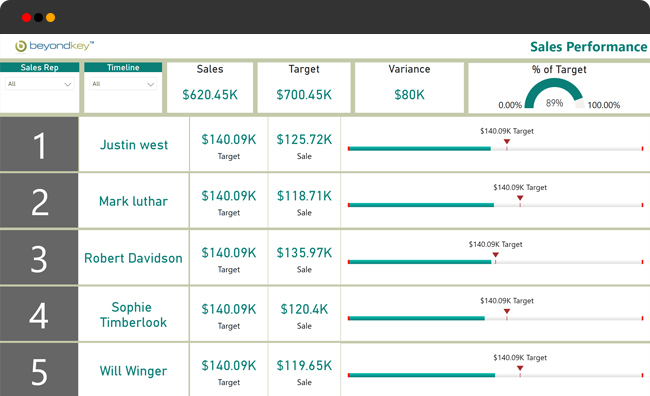
Sales Performance Dashboard
The sales performance dashboard as the name suggests is a very important report. It is useful for the stakeholders and all the top executives from the sales team to monitor this dashboard. It shares insights into the performance of people who are responsible for the sales in the organization. Key metrics like what are the targets for each, how much are met, and who is performing and who is not able to perform- all these insights can be analyzed after looking at this sales performance dashboard.

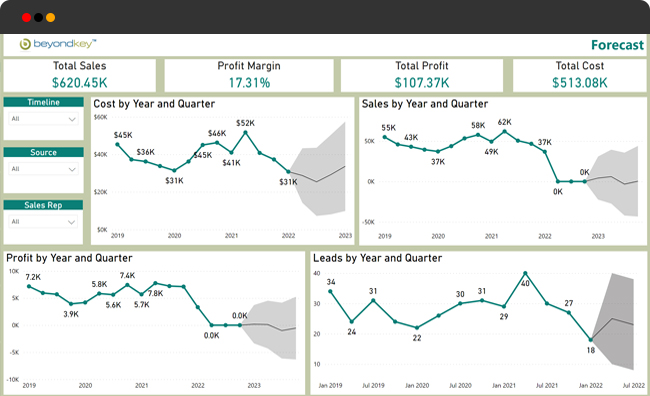
Sales Forecast Dashboard
Another crucial report is the Sales Forecast Dashboard. It enables you to make more informed decisions in the future. Based on historical data, it predicts the values of your essential data that affect your business for future days.

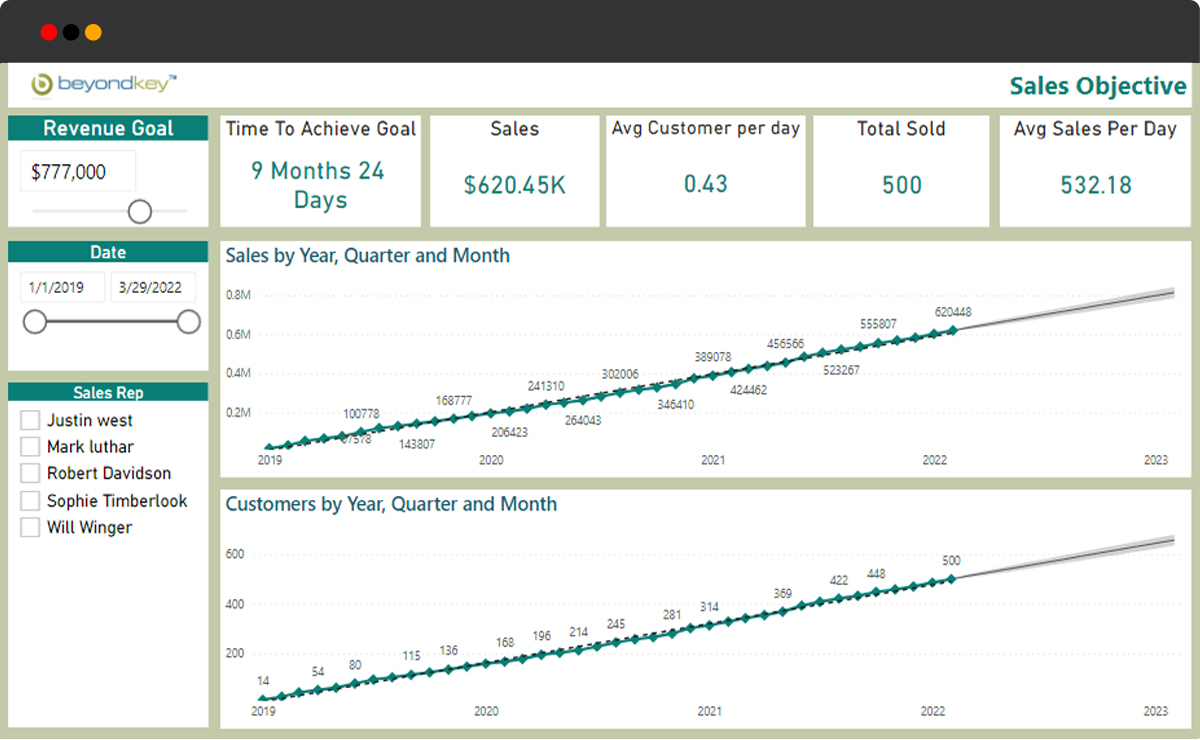
Sales Objective Dashboard
The Sales Objective report contains information about your goal as well as the amount of time it took you to achieve it, so you can plan your strategy accordingly. You can adjust your goal on the fly and obtain an estimate of how long it will take you to attain it.
Our Approach to Developing Sales analytics dashboards
Phase 1
Finalizing the requirement
Assessment session
Envisioning session
Designing Workshop
Phase 2
Implementation
Deliverables
Design and Development
Phase 3
Deployment
Testing and Deployment
Phase 4
Maintenance
Support and Maintenance
Beyond Key Advantage
With over 18 + years of BI and analytical services, Beyond Key has the experience your organization deserves. As Microsoft Gold providers, we know how to uncover insights hidden in your data and enhance your data exploration capabilities.
20+Years of Experience
350+Skilled Experts
50K+Product Downloads
500+Clients


Leading building materials company gets Power BI sales analytics dashboards to track their major KPIs
Read the case studyIndustries
Interested to know more about our Sales dashboards and analytics capabilities?
Resources

Best Power BI Dashboard Examples for HR, Finance, and Project Management teams
Lately, we have had a lot of organizations..

How Business Intelligence can be useful for Government agencies
Government agencies in any country are some of the biggest data collecting and storing..

What is Power BI
Microsoft Power BI offers a way for your organization to visually access your data. In a world that continues to see massive data..

Microsoft Power BI reports developed to manage end-to-end HR analytics, people information and data.
Beyond Key’s Business Intelligence team developed custom Power BI dashboards and predictive analytical reports for the HR..

Leading building material company leverages sales dashboards to improve business efforts
We created Microsoft Power BI sales reports for our US-based client to help their sales team make better decisions.

Leading NPO leverages Business Intelligence tools to turn data into live visualization.
Beyond Key’s, Business Intelligence experts used DOMO to create awesome dashboards for leading NPO..

Develop A Better Workplace With HR Analytics & Power BI
Is your HR team looking for a better way to make decisions that positively impact your organization's corporate culture? In that case..
Business Forecasting With Power BI
The ability to peek into the future is a superpower every business wants. Whether you want to increase your profits..
Data Visualization: Comparing Power BI, Tableau, And Domo
Data tells a story of where your company has gone and where you can go. The question is, do you see where it can..


