Data is the blueprint for your next big move. To understand this better, let’s understand what is data analytics? Data analytics is a process of examining and interpreting bundles of raw information to process trends, patterns and actionable insights.
For Australian businesses, it is not optional now – it has become essential for staying competitive, enhancing customer experiences, strengthening data usefulness and driving business growth. In this blog, I will guide you through those fundamentals on what is data analytics, why it matters, the different types, techniques and the success metrics on how to get it started in Australia.
Data analytics is the process of analysing raw data or information to uncover patterns, trends and insights that support business decisions. It helps businesses to rely on facts and numbers from database analytics instead of making any assumptions.
Today, businesses collect huge volumes of data from multiple customer interactions across operations, sales, finances, digital channels and other internal systems. However, without any database analytics, there is only a pile of unused data. Data analytics turns raw data into the right information that supports business growth.
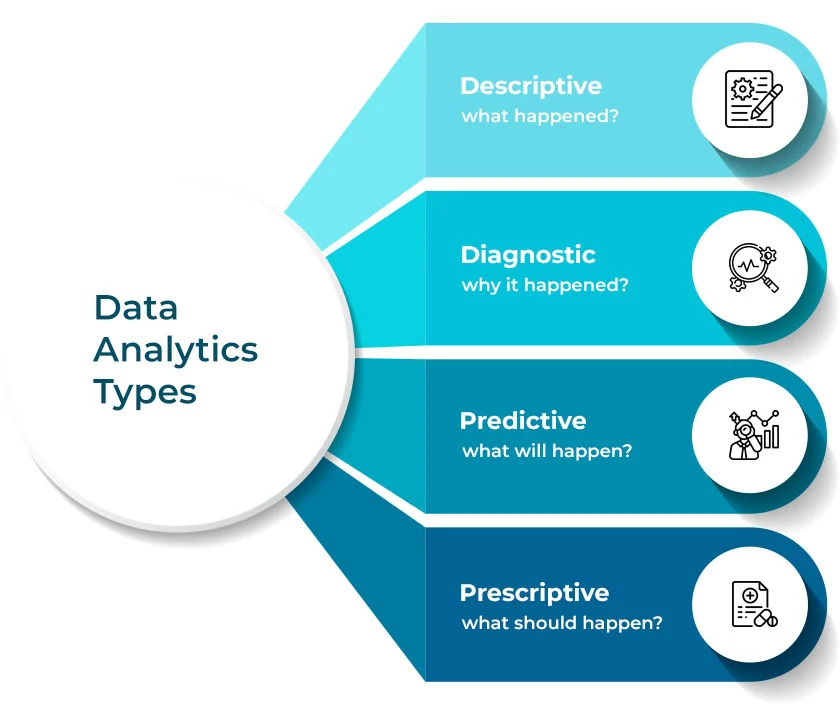 There are 4 major types of data analytics, with each playing an important role:
1. Descriptive Analytics – ‘What’ of data
Descriptive analytics provides summaries of historical data which show reports on past trends and performances.
This analysis is done with tools like MS Excel, Google Sheets, Power BI, Tableau, and Google Analytics.
For example, a fashion retailer in Brisbane used descriptive analytics to track the sales per week. This way, they noticed a jump in sales between September-November (springtime). These insights helped them to prepare for inventory and marketing a month prior.
2. Diagnostic Analytics – ‘Why” of data
Diagnostic analytics gives detailed information on the causes related to any data. It links the descriptive patterns of any event, campaign or any changes in business systems to find potential reasons behind the trends.
The common outputs generated by these analytics include root cause analysis, funnel analysis, drop-off points analysis, and segment-wise correlation analysis.
Teams generally work with analytical tools like Google Analytics, Power BI, Tableau, and Python (pandas) to understand the causes of any unexpected changes in business.
For an analytical data example, an eCommerce retailer in Sydney saw a sudden drop in business sales. Diagnostic analytics revealed insight into slowed page load times for the website on mobile, with mobile traffic making up 60% of sales. They fixed the page and restored the conversions.
3. Predictive Analytics – ‘what will happen next’
Predictive analytics look at historical patterns to forecast what’s likely to happen next in a business. It helps to anticipate demand, churn, revenue and risk in advance.
Some common tools used for predictive analytics are Python, R, Azure, Amazon SageMaker and Snowflake, along with BI tools.
For an analytical data example, a Melbourne streaming service provider ran analytics on metrics like viewed history, subscription tenure and overall engagement to predict subscription cancellation in the next 90 days. They then planned to run targeted retention campaigns for high-risk users.
4. Prescriptive Analytics – “What should we do about it?”
Prescriptive analytics suggests concrete actions to achieve the desired outcomes, like cost reduction, increased retention, etc., for any business. It is built on predictive models and applied optimisation on decision rules.
The tools usually used are Python (optimisation libraries), integrated BI and automation and specialised automation platforms for action recommendations and optimisation results.
For an analytical data example, a logistics operator in WA used prescriptive analytics to combine traffic forecasts, weather data and vehicle capacity to plan the optimal delivery schedules, minimise fuel usage and on-time failures during heavy rainy season.
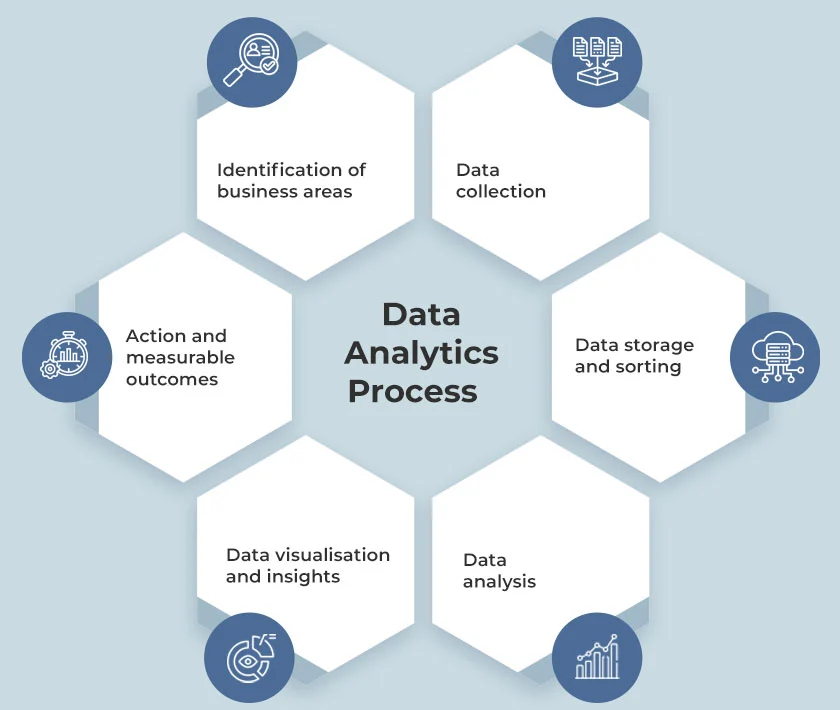 To fully understand what is data analytics, here’s a detailed step-by-step process of database analytics and data usefulness, explained in detail.
1. Identification of Business Areas
The first step of data analytics starts with clarity on what we are trying to find out. It could be anything on “Why there is a decline in repeat purchases”, “Which regions are most profitable”, or “How can we reduce delivery delays”?
2. Data Collection
Once the metrics have been identified, we can find the sources of the right information, like CRMs, billing tools, POS systems, surveys, apps, marketing platforms, ERP systems, and customer service records.
3. Data Storage and Sorting
Raw data is very messy and hard to comprehend, as it is unorganised, duplicate and scattered. At this step, data is cleansed to remove duplicates, fix errors and fill in missing values. Later, data sorting helps to make sense of the data by putting it in the right place and the right format – ready to be analysed.
4. Data Analysis
Tools and techniques are introduced at this step to start digging for patterns, trends, correlations, bottlenecks and opportunities.
5. Data Visualisation and Insights
At Data visualisation step, analysis becomes meaningful. In this step, analysts create dashboards, charts and short summaries that highlight core information on what has changed, why it changed, and what action is needed next.
This step is gaining significant rise in the Australian public sector for day-to-day public sector decision-making.
“The Digital Transformation Agency’s 2030 strategy highlights a push towards “world-class data and digital capabilities”. A recent Australian government Copilot trial – involving 5000+ staff across 60 agencies – showed that nearly 70% of completed tasks are faster using AI. With such digital investment plans beginning from July 2025, use of clear dashboards and visual summaries is becoming essential for government decision-making.”
6. Action and Measurable Outcomes
Analytics can only work successfully when the insights are turned into actions. For example, with business data and insights, prices are adjusted based on customer demands, staff is increased to accommodate identified peak demand, targeted campaigns for high-value customer segments are run, etc.
When businesses clearly understand the concept of what is data analytics, it will become easier for them to connect data from multiple systems, interpret it correctly and act on insights with a confident strategy.
Turn scattered business data into clear insights for faster decision-making.
Get startedToday’s analytics stack is evolving fast, and Australian businesses who understand what is data analytics use various cloud platforms, visualisation tools, and AI-assisted workflows to turn raw data into practical insights across:
| Data storage and databases | SnowFlake |
| AWS Redshift | |
| Azure SQL Database | |
| ETL and data integration | Talend |
| Azure Data Factory | |
| Fivetran | |
| Data visualisation and BI | PowerBI |
| Tableau | |
| Qlik Sense | |
| Analytics and modelling | Python |
| R | |
| SAS | |
| Marketing and customer analytics | Google 4 |
| Adobe Analytics |
Data analytics helps businesses to understand the “what’s”, “why’s”, and “what will” events of their business data. It is a powerful way to make informed business decisions that drive growth and improve operations.
To get data analytics started for Australia:
If you choose the right data analytics consulting vendor, it will help align your data analytics strategy with business goals, bring data together from business systems, and provide insights are reliable and actionable. The right data analytics consulting partner also brings domain expertise, technology know-how, and best practices to support long-term data-driven decision-making.
Australian businesses can partner with Beyond Key for data analytics consulting to leverage its expertise in designing, implementing and managing analytics solutions, tailored to their business needs. We help Australian companies take full control of their data – sourcing, visualising and using AI to predict what’s next. It’s much more than efficiency – it’s about sharpening your competitive edge and delivering a better customer experience, even when the market shifts.
1. What is the purpose of data analytics?
Data analytics helps you to make smarter decisions using business information. It helps them to understand performances and metrics in the past, fix current issues, and predict future actions.
2. What is an example of data analytics?
Imagine an Australian retailer diving into their sales history to analyse when the “summer rush” begins. Instead of guessing, he uses the insights to stock up on shelves and time their ad spend to be done as customer demand peaks.
3. What are the 4 types of data analytics?
Descriptive analytics: What happened?
Diagnostic analytics: Why has something happened?
Predictive analytics: staying ahead of any event.
Prescriptive analytics: recommendations into next actions.
4. What is data analytics and how does it work?
Data analytics work by deciding which business problem you are trying to solve. Then businesses should collect data from multiple sources, organise it, analyse it using statistical techniques and visualise it through dashboard and reports.